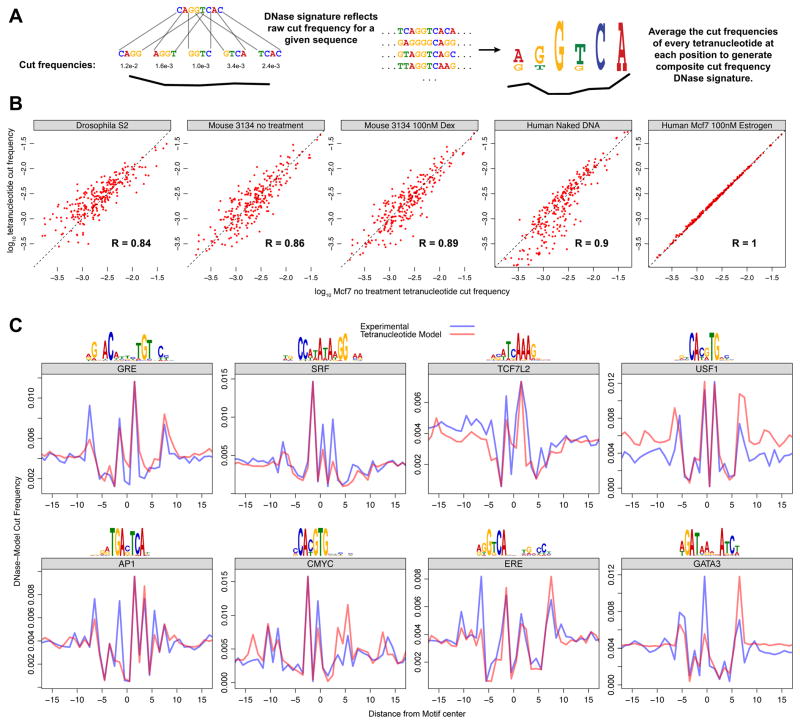
Figure 5. DNase cut signatures of many TF motifs can be predicted from tetranucleotide preference for cleavage using seqToSign.
(A) For any given sequence, we expect that the relative DNase cut frequency at a particular site would directly reflect the genome wide experimental cut frequency for that particular tetranucleotide. For a set of sequences compiled to build a composite profile, the cut frequency for a given position is derived from the relative abundance of all the 256 possible tetranucleotides at that position. (B) Raw tetranucleotide cut frequency for DNase experiments are highly correlated, across diverse organisms and experimental treatments. The x-axis is the raw cut frequencies for all 256 tetranucleotides in Mcf7 cells. These correlate to the cut frequencies for DNase digestion of Drosophila S2 chromatin, 3134 mouse cell chromatin with and without dexamethasone treatment, naked DNA from IMR90 cells, and Mcf7 cells with the addition of Estrogen. (C) We compared the DNA cut signatures (model) predicted by seqToSign with the naked DNA (experimental) cut-profiles. As in Figure 4, we scaled the seqToSign traces such that each can be viewed relative to the experimental trace. (See also Figures S4–S5)

