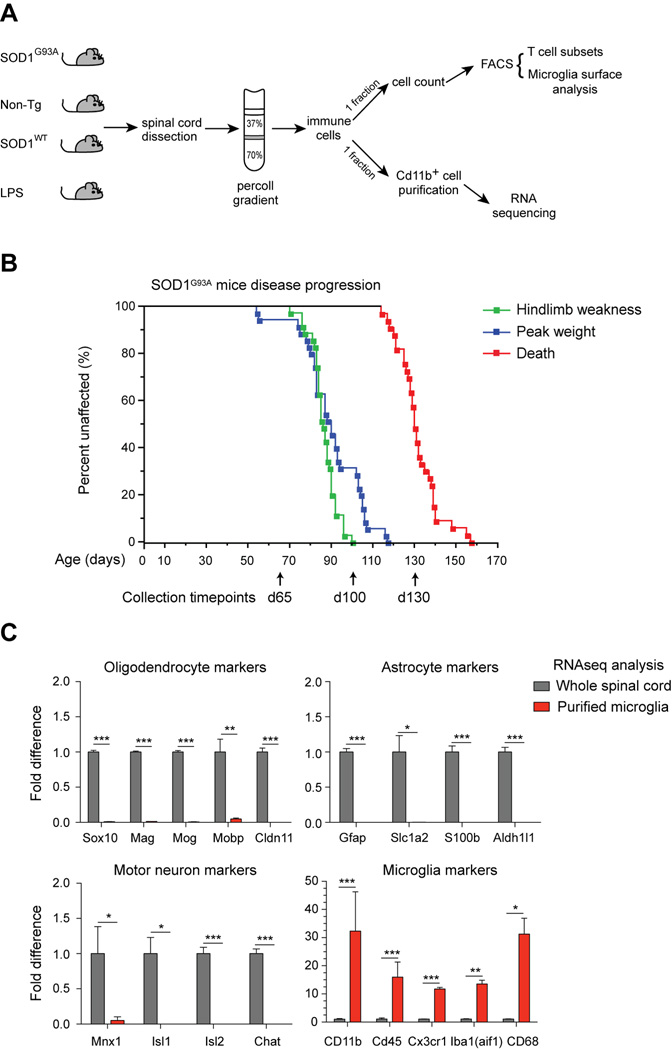
Fig. 1.
Transcriptional profiling of purified spinal cord microglia and parallel flow cytometry analysis. (A) Percoll gradient isolated leukocytes from SOD1G93A, non-Tg littermate, SOD1WT, and LPS injected mice were subjected to FACS analysis (T cells, microglia) and CD11b+ microglia purification for RNAseq. (B) Kaplan Meier curves of disease progression in SOD1G93A mice (n=35), showing onset of hindlimb weakness, peak weight, and death. Spinal cords were dissected at day 65, day 100, and day 130/end stage for microglia analysis. (C) Plots of relative transcript levels of purified microglia compared to whole spinal cord, examining oligodendrocyte (Sox10, Mag, Mog, Mobp, Cldn11), astrocyte (Gfap, Slc1a2, S100b, Aldh1l1), motor neuron (Mnx1, Isl1, Isl2, Chat), and microglia (Cd11b, Cd45, Cx3cr1, Iba1, Cd68) markers. Values are fold-change ± s.e.m. (*, p<0.05; **, p<0.01; ***, p<0.001 by t-test). See also Figure S1.

