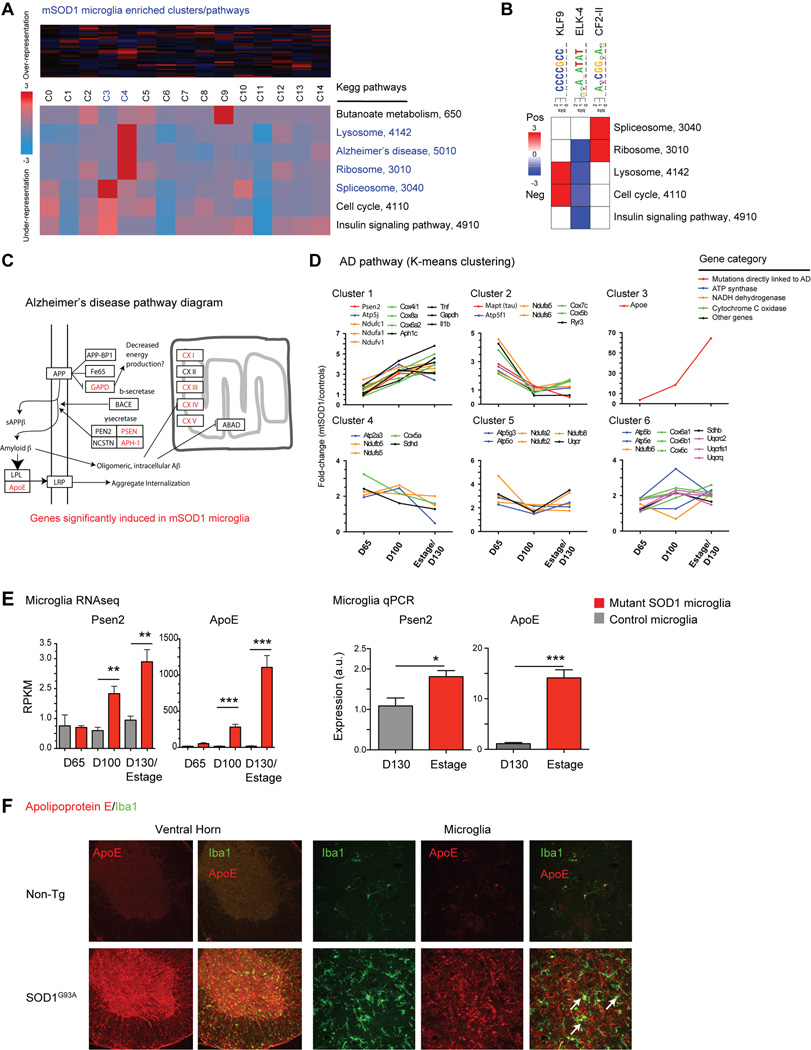
Fig. 6.
Pathway analysis shows dysregulation of Alzheimer’s disease genes in mutant SOD1 microglia. (A) iPAGE analysis finds significant enrichment for ribosomal, lysosome, RNA splicing, and Alzheimer’s disease KEGG pathways in SOD1G93A microglia compared to control microglia (clusters C3, C4). (B) Transcriptional motif enrichment analysis finds 3 positively enriched transcriptional motifs linked to KEGG pathway changes. (C) SOD1G93A microglia show significant dysregulation in Alzheimer’s disease (AD) genes, as shown in this pathway diagram (adapted from KEGG). (D) AD pathway genes were grouped by K-means clustering and plotted over time by fold-difference between SOD1G93A vs. control microglia. Genes whose mutations directly link to AD and components of ATP synthase, NADH dehydrogenase, cytochrome C oxidase, and other AD pathway genes are differentially increased in SOD1G93A microglia (E) Presenilin 2 (Psen2) and Apolipoprotein E (Apoe) levels are upregulated in SOD1G93A microglia by RNAseq and qPCR analysis (*, p<0.05; **, p<0.01; ***, p<0.001 by t-test). (F) Immunostaining of spinal cord sections shows significant upregulation of ApoE throughout the ventral horns of SOD1G93A compared to non-Tg spinal cords. Higher magnification images show microglia (Iba1+) colocalization with ApoE. Scale bars, 50 µm. Error bars, mean±s.e.m.

