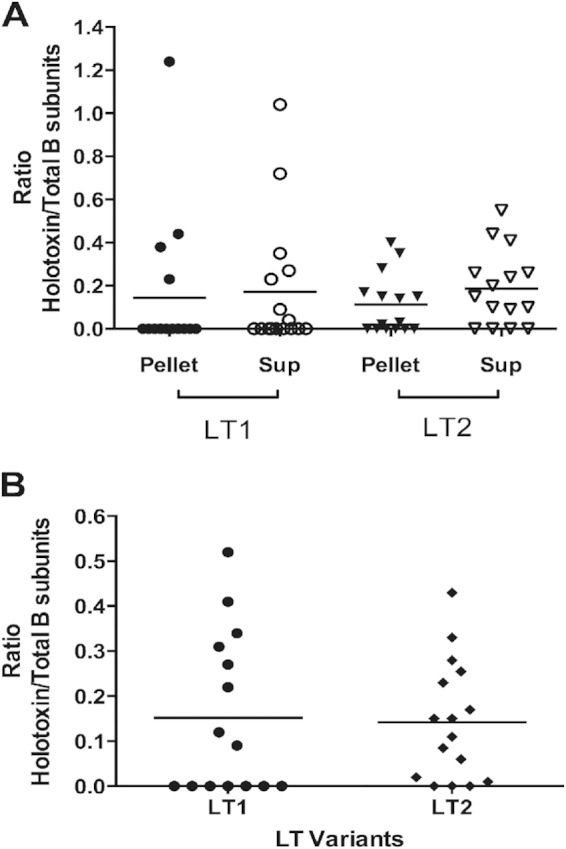
FIG 6.

LT stability analysis in ETEC strains expressing LT1 and LT2. (A) Proportion of stable LT in the sonicated bacteria (Pellet) and supernatants (Sup). (B) Total ratio of stable LT in both the pellet and supernatants. The ratio of stability was calculated as (nanograms of LT holotoxin)/(nanograms of the B subunit). The amount of LT holotoxin was determined with a MAb against the A subunit, and the amount of the B subunit was determined with a MAb against the B subunit. Horizontal lines indicate mean values. The statistical analysis was performed by the Mann-Whitney U test using Prism, version 6.00. No statistical differences were found.
