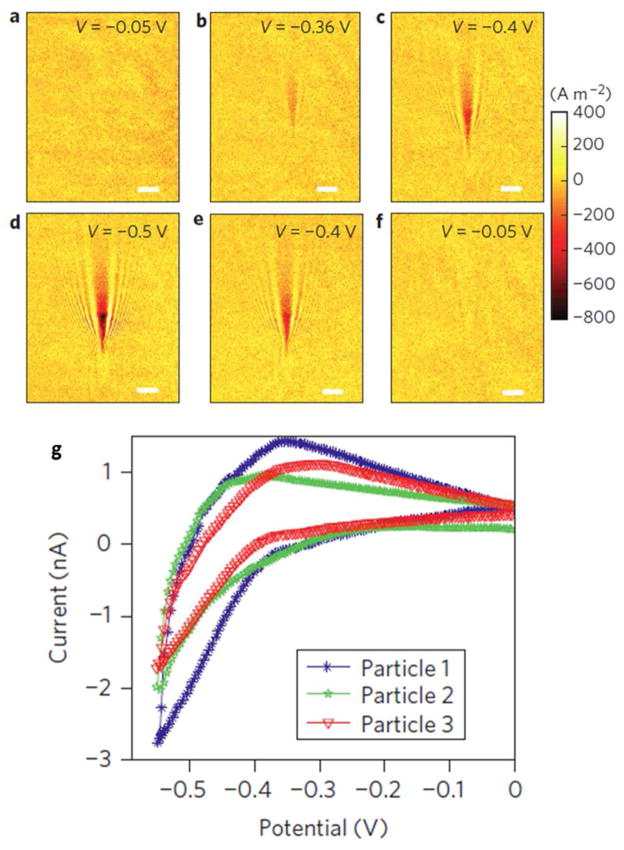
Fig. 5.
Plasmonic-based electrochemical current images of a single 80-nm Pt nanoparticle at different potentials during a cyclic voltammetry scan. (a–f) Current density images of a single 80 nm Pt nanoparticle at potentials of − 0.05, −0.36, −0.4, −0.5, −0.4 and −0.05 V, respectively. (g) Typical cyclic voltammograms of three different single Pt nanoparticles resolved by P-ECM. Scale bars (a–f): 3 μm. Adapted by permission from Macmillan Publishers Ltd:[Nature Nanotechnology] (Ref. 98), copyright (2012).

