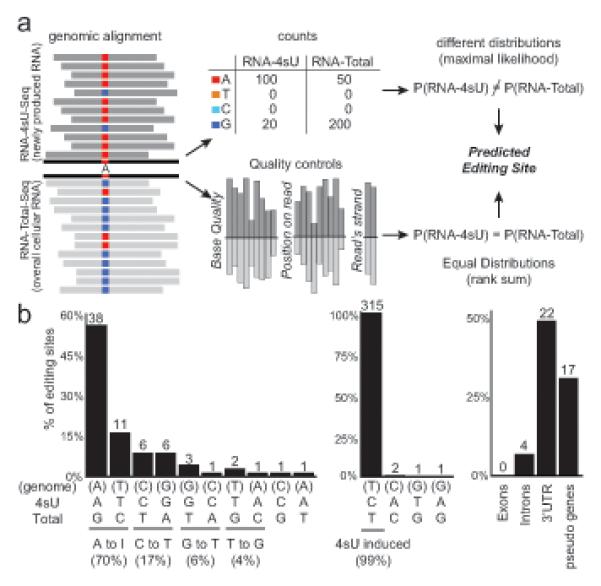
Figure 7. High resolution metabolic labeling can reliably detect RNA editing.

(a) Method for detecting editing sites. We search for positions where the distribution of sequenced nucleotides is different in RNA-4sU-Seq (dark gray, top) and RNA-total-Seq (light gray, bottom) using maximum likelihood estimation (top row), and also require that other measures associated with base quality distribute evenly between the two samples (bottom row). (b) Distribution of predicted editing sites (% of sites, y-axis). Left: nucleotide changes in RNA-total (editing sites, nucleotide changes on x-axis; top: genomic base, middle: RNA-4sU base, bottom: RNA-total base), middle: nucleotide changes in RNA-4sU data (4sU induced base changes), right: distinct annotations associated with RNA-total nucleotide changes. Number of sites is marked. See also Table S3.
