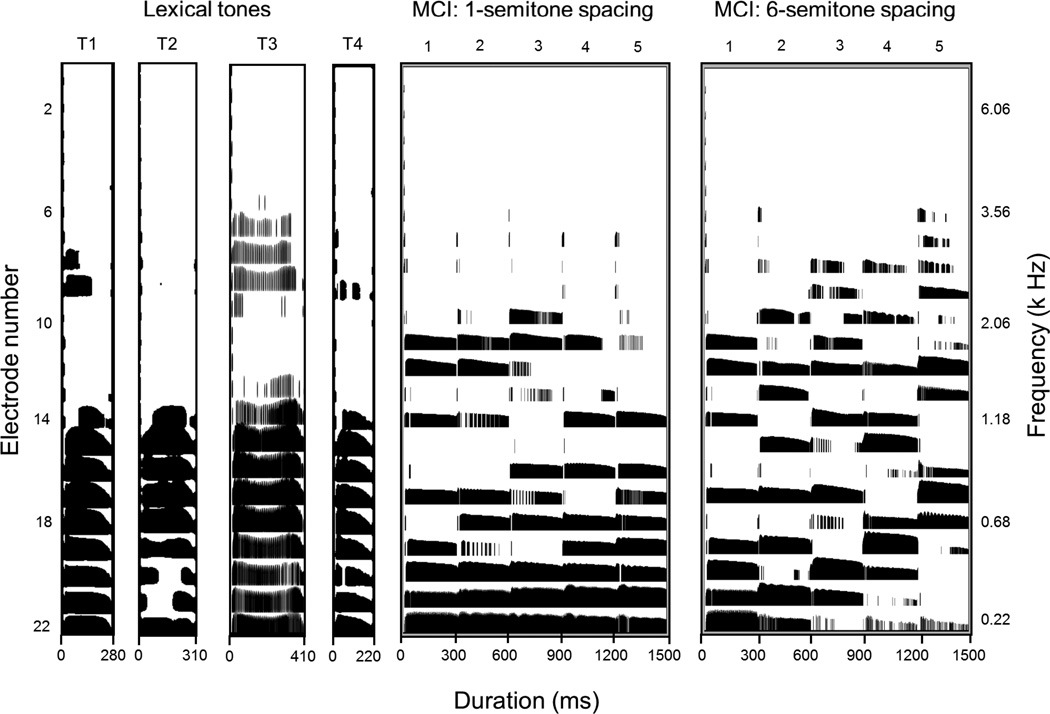
Figure 2.
Electrodograms for 4 lexical tones (left four panels) and 2 melodic contours (right two panels). The x-axis shows time, the left y-axis shows electrode number (from most apical electrode 22 to most basal electrode 1) and the right y-axis shows the acoustic frequency assigned to the electrodes. For the melodic contours, the numbers 1–5 at the top of the panel indicate each note in the contour. The electrodograms were generated using the default clinical stimulation parameters for the Cochlear Freedom CI device.

