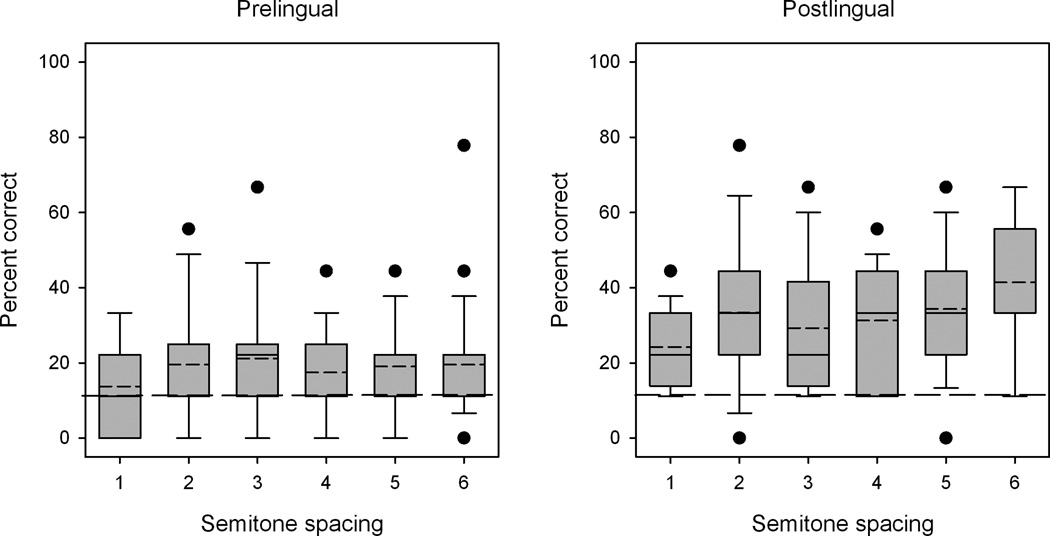
Figure 4.
Boxplots for MCI performance for prelingually deafened (left panel) and postlingually deafened CI participants (right panel). The short dashed lines show median value, the solid lines show mean value, the error bars show the 10th and 90th percentiles, and the circles show outliers. The long dashed line indicates chance level performance (11.1% correct).

