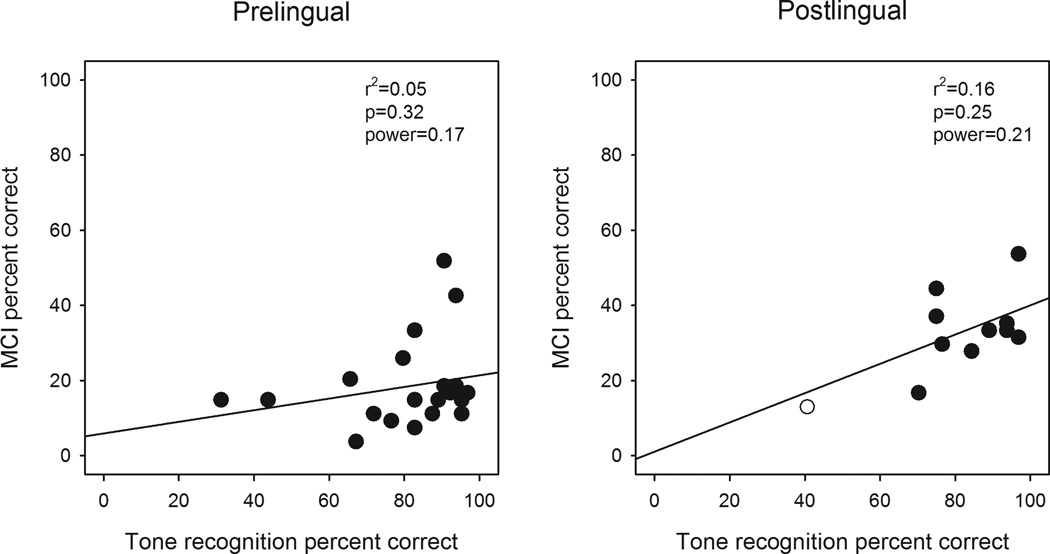
Figure 5.
MCI performance for individual subjects as a function of lexical tone recognition performance, for prelingually deafened (left panel) and postlingually deafened CI participants (right panel). For lexical tone data, performance was averaged across talkers and tones; for MCI data, performance was averaged across semitone spacings. The dashed lines show linear regressions fit to the data; r2, p, and power values are shown near the regression lines. For postlingual participants, the regression analysis shown was performed excluding participant S28 (white circle), as tone recognition performance was much poorer than for the other participants.

