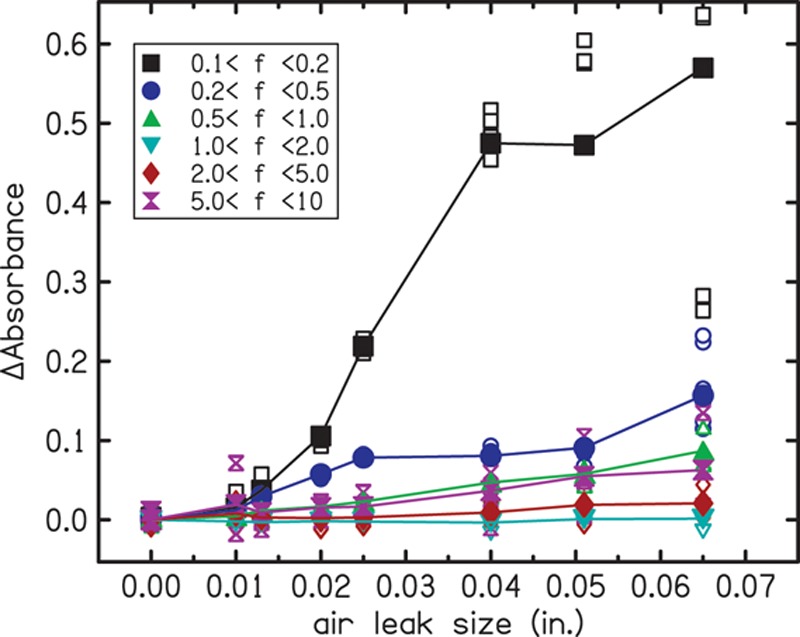
Fig. 3.

ΔAbsorbance as a function of the leak size in the brass cavity measurements. The parameter is the frequency band in which the estimates were made, represented by different symbols and colors as indicated in the inset. Open symbols indicate repeated measurements and filled symbols indicate the mean. ΔAbsorbance greater than zero can be observed in nearly all of the frequency bands but is largest in the lowest frequency band. A color version is available online.
