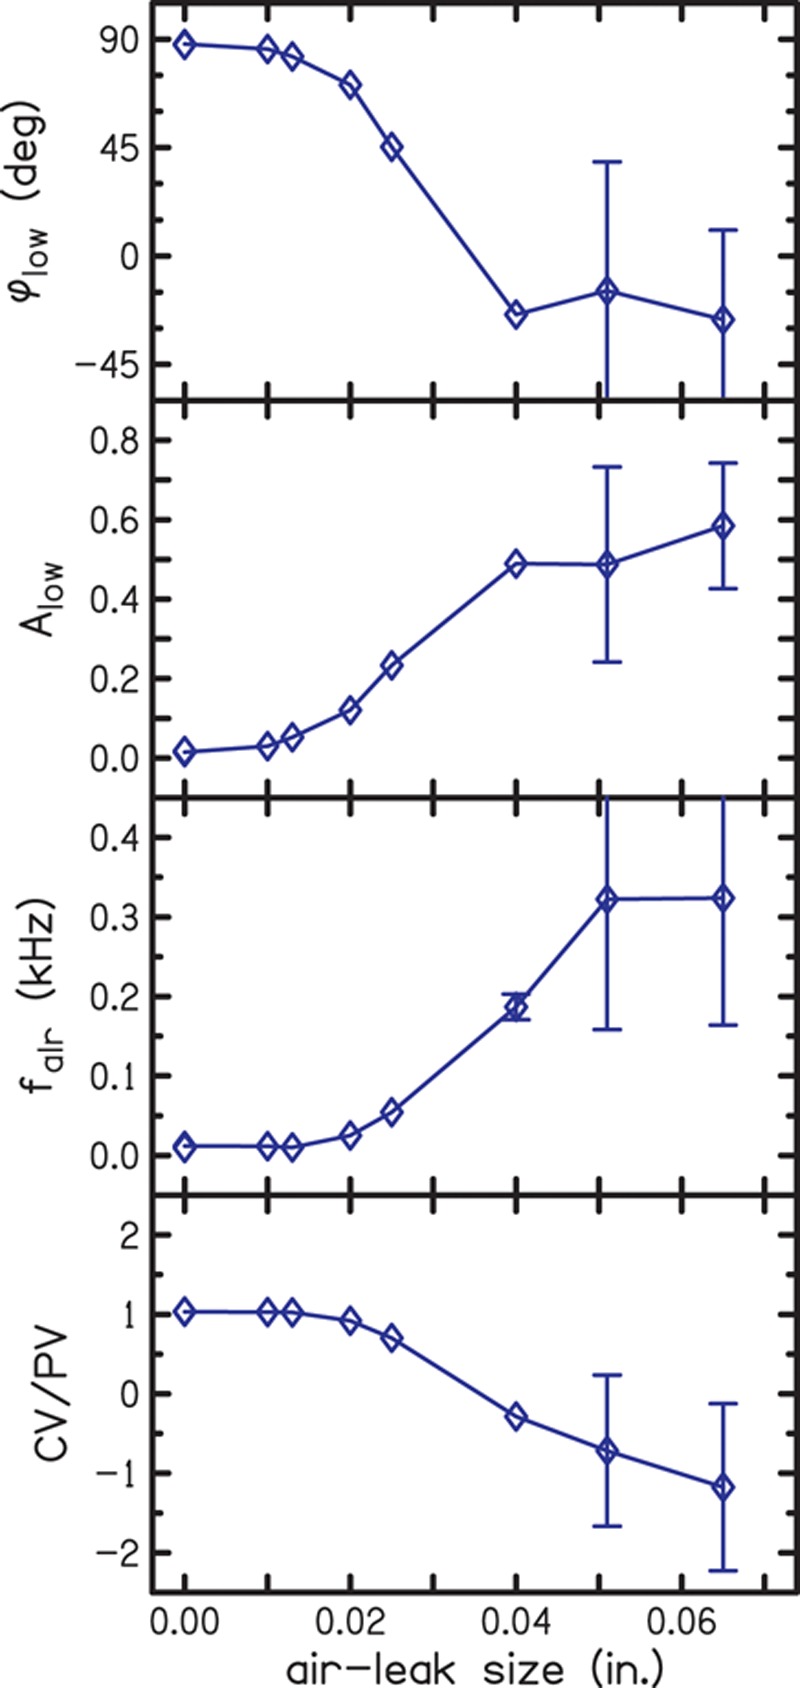
Fig. 4.

Quantifying air leaks by diameter in a brass cavity using the four predictor variables: (1) the admittance phase at low frequency (φlow), (2) the absorbance at low frequencies (Alow), (3) the resonance frequency of the air leak (falr), and (4) the ratio of compliance volume to physical volume (CV/PV). Low-frequency admittance phase and absorbance were calculated as averages over the frequency range of 0.1–0.2 kHz. The brass tube had 38.7 mm length and 8 mm i.d. (volume of 1.95 cc). The diamonds represent the mean results for the air-leak diameters, which are connected by the lines to better illustrate the trend. Error bars indicate SDs and show the greatest variability in the measurements at the two largest diameters. A color version is available online.
