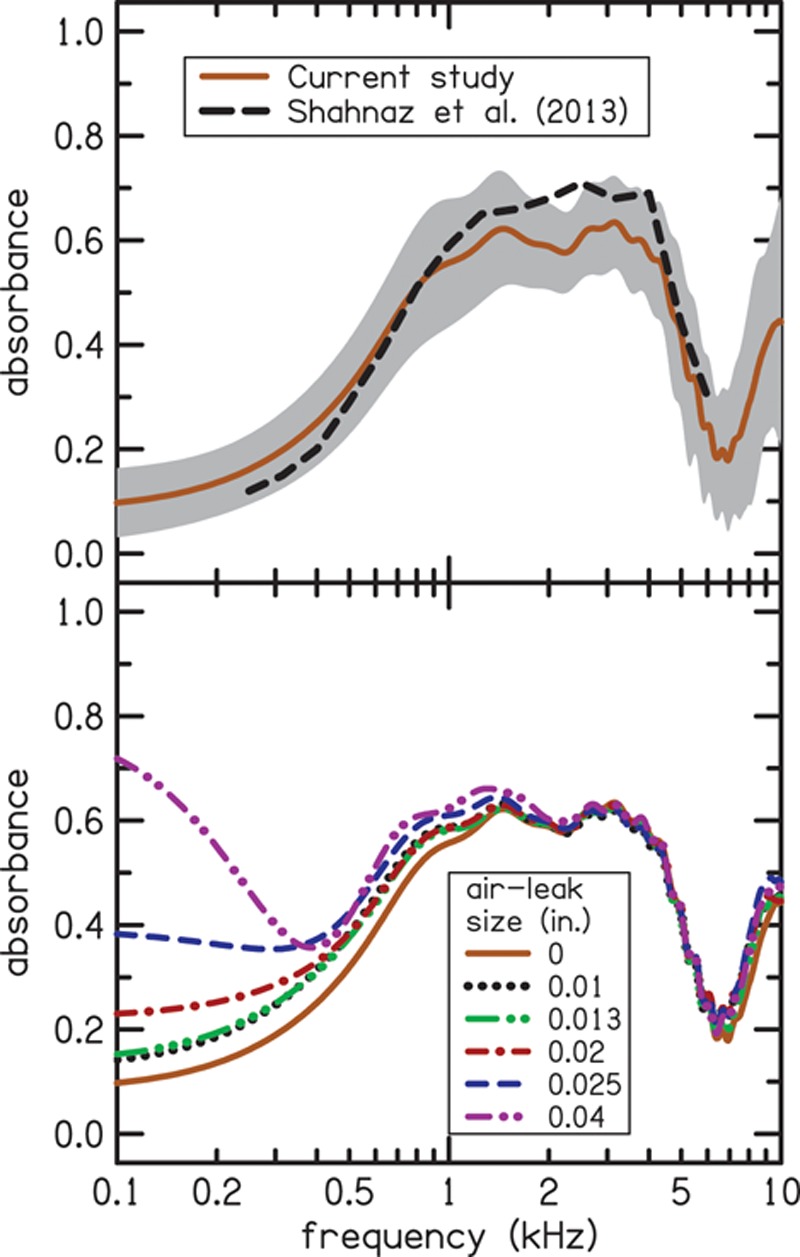
Fig. 5.

The top panel shows mean absorbance for the condition without an air leak. The shaded region indicates the standard deviation. Our data is similar to the data of Shahnaz et al. (2013) (shown as dashed line), which included 186 participants and was collected using different measurement equipment. However, our data covers a wider frequency range, a consequence of the custom measurement equipment. The bottom panel shows the effect of the size of the air leak on mean absorbance. Leak sizes are indicated using different colors and line styles as shown in the inset. Absorbance increases in the low frequencies (below 0.4 kHz) as the size of the air leak increases. A color version is available online.
