
Fig. 8.
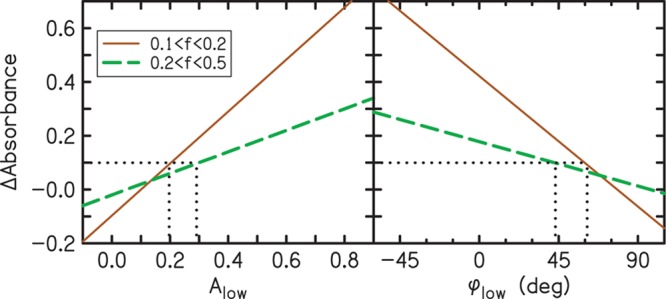
Summary of the criteria that have the strongest correlations with air leaks. The solid and dashed lines are simple linear regression fits to the data of Fig. 7 for frequency bands of 0.1–0.2 and 0.2–0.5 kHz, respectively. The two dotted lines show the values of Alow and φlow that correspond to a significant change in Δabsorbance. No leak is indicated when the value of Alow is less than 0.20. In the 0.1–0.2 kHz band, a leak is indicated when Alow is in the range from 0.20 to 0.29 and in the 0.2–0.5 kHz band, a leak is indicated when Alow is greater than 0.29. Likewise, φlow indicates no leak when φlow is greater than 61 degrees. In the 0.1–0.2 kHz band, a leak is indicated when φlow is in the range from 44 to 61 degrees and in the 0.2–0.5 kHz band and a leak is indicated when φlow is less than 44 degrees. A color version is available online.