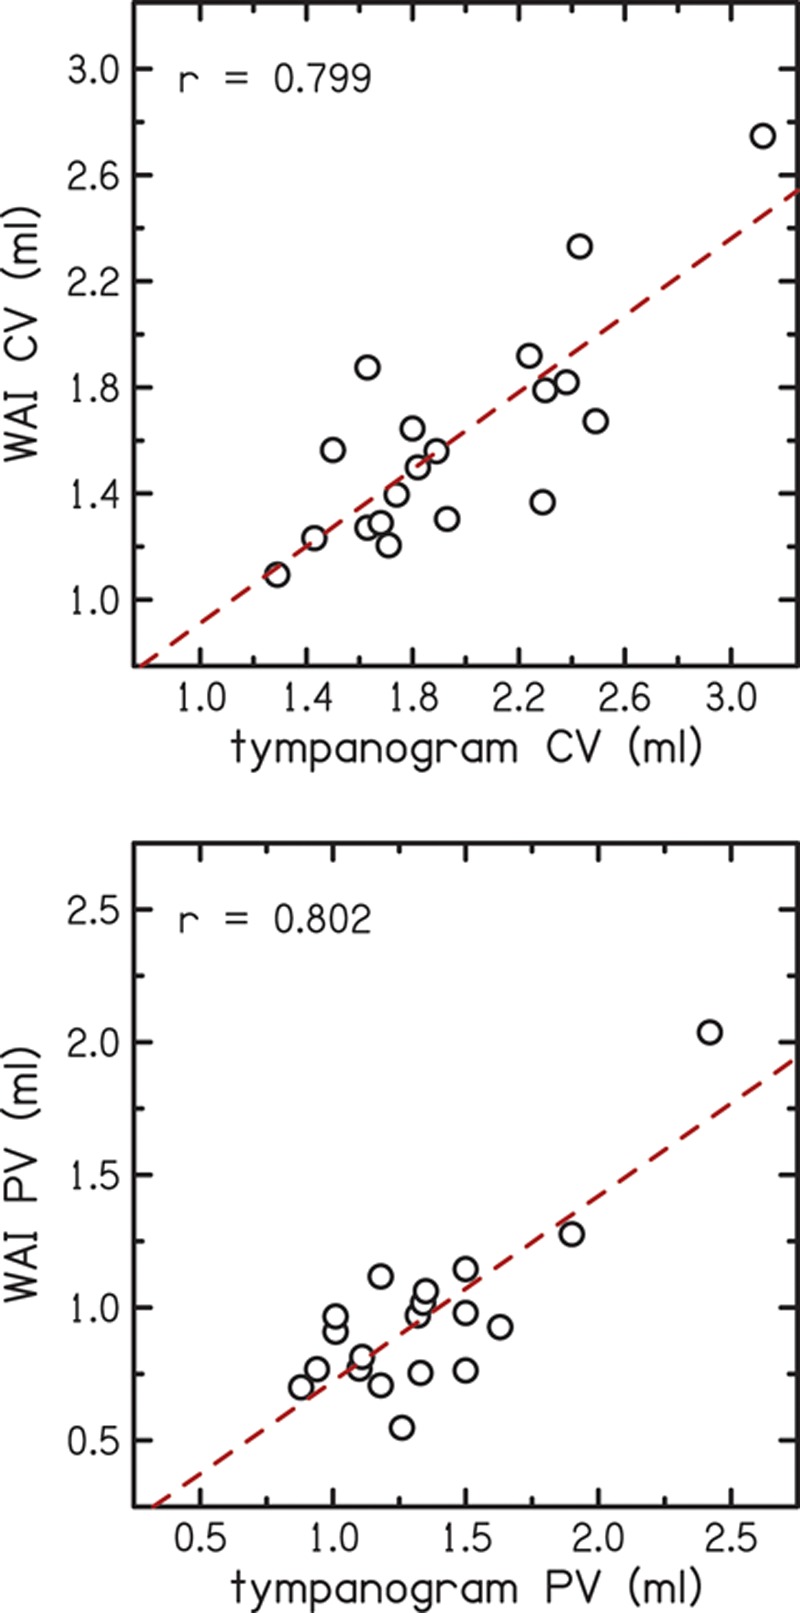
Fig. 9.

Comparison of compliance volume and physical volume determined using wideband acoustic immittance (WAI) to tympanometric values. In the top panel, the y-axis is the compliance volume derived from the WAI measurements and the x-axis shows compliance volume from the tympanogram. In the bottom panel, the y-axis is the physical volume derived from the WAI measurements and the x-axis shows physical volume from the tympanogram. The dashed lines indicate simple linear regression fits to the data. A color version is available online.
