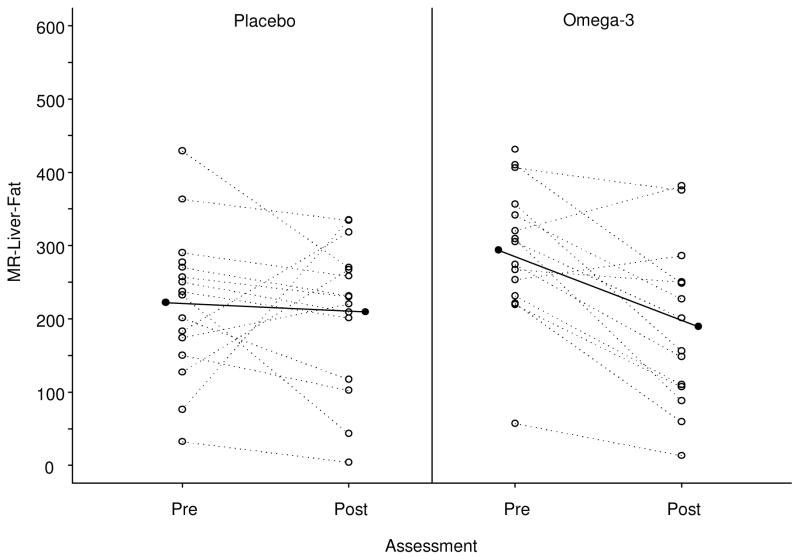
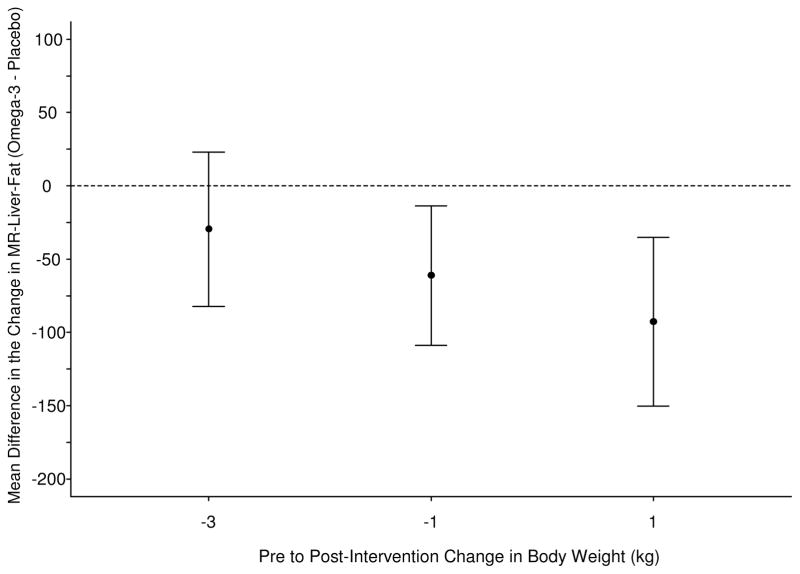
Figure 3. Changes in liver fat assessed by MRI.
(A) Scatterplot and trend-line of adjusted MRI liver fat measurements at baseline and end-of-study. N-3 led to significant improvement in liver fat compared to placebo.
(B) Mean difference in pre to post-intervention change in MR-Liver-fat, between N-3 and placebo evaluated at the 1st, 2nd, and 3rd, quartiles of the pre to post-intervention change in body weight distribution. N-3 intervention appears to have greater effects in patients with lesser weight loss or weight gain.


