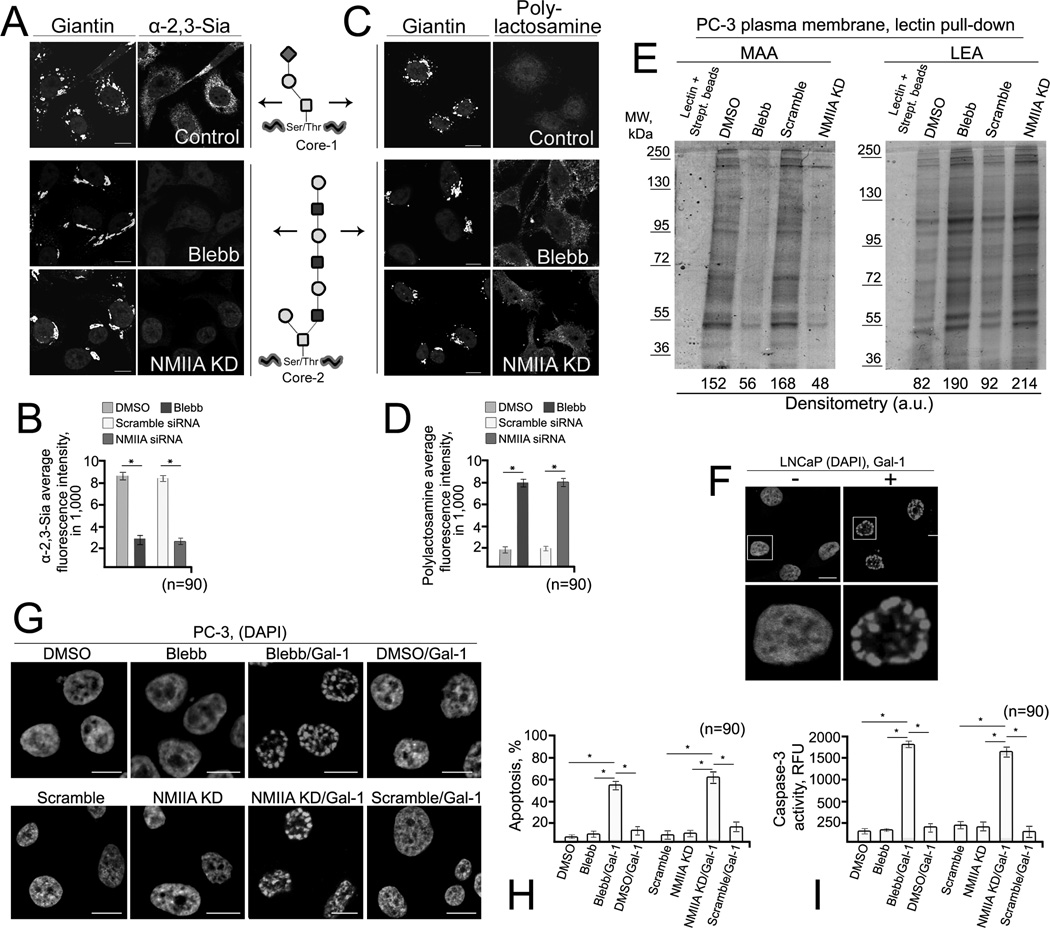
Figure 7. Restoration of the compact Golgi in PC-3 and DU145 cells redirects O-glycosylation pathway.
(A, C) Images of immunostained giantin, MAA lectin-stained α-2,3-Sia and LEA lectin-stained polylactosamine in PC-3 cells treated with Blebbistatin or NMIIA siRNAs. (B, D) Quantification of α-2,3-Sia and polylactosamine-specific average integrated fluorescence (in a.u.) in the cells shown in A and C, respectively. (E) The 8% SDS PAGE of PC-3 cell plasma membrane fraction pull-down with biotinylated lectin MAA or LEA followed by capturing with streptavidin magnet beads. (F) DAPI staining of LNCaP cells treated with 10 µM galectin-1 for 7 h. Cells treated with corresponding amount of DTT served as a control. (G) DAPI staining of PC-3 cells treated with DMSO, Blebbistatin, or scramble or NMIIA siRNAs and then with or without 10 µM galectin-1. (H, I) The percentage of apoptotic cells and caspase-3 activity in cells presented in G. Apoptotic nuclei were counted in 30 different fields, each from three independent experiments and the apoptotic cells were expressed as % of total cells. Caspase-3 activity is expressed as mean relative fluorescence units (RFU) from three independent experiments. Bars, 10 µm; *, p<0.001.

