Figure 3.

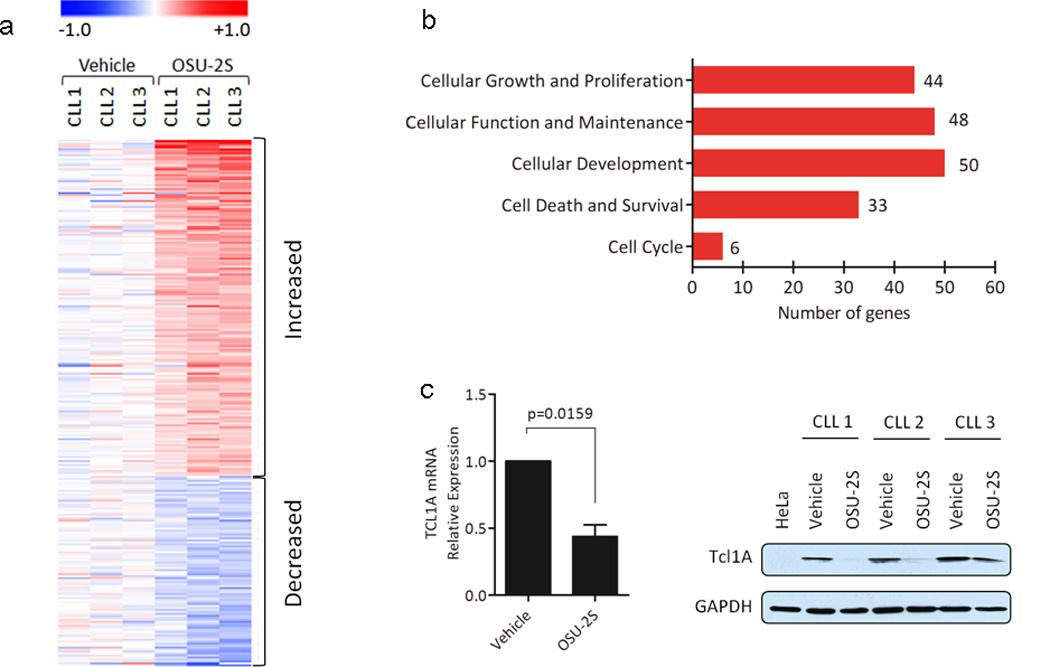
Gene expression analysis of CLL cells treated with OSU-2S. (a) Heat map of 266 differently expressed genes in OSU-2S treated CLL. RNA was isolated from CLL cells (N=3) treated with vehicle or OSU-2S(8µM) at 16 hours and subjected to microarray analyses using GeneChip Human Genome U133 plus 2.0 (Affymetrix, GPL570). After statistical analyses, genes that changed by ≥ 2 fold and p<0.0005 in response to OSU-2S treatment were used for constructing a heat map. (b) Top five molecular and cellular functions revealed through Ingenuity Pathway analysis (IPA) of genes modulated by OSU-2S in CLL. (c) OSU-2S down modulates TCL1A. RNA was extracted from vehicle or OSU-2S treated (16hr) CLL patients cells (N=7) and TCL1A expression relative to 18S was determined by real-time RT-PCR analysis and values are normalized to vehicle control; bars represent SD. Immunoblot of TCL1A in CLL cells treated with vehicle or OSU-2S for 24 hours is also shown.
