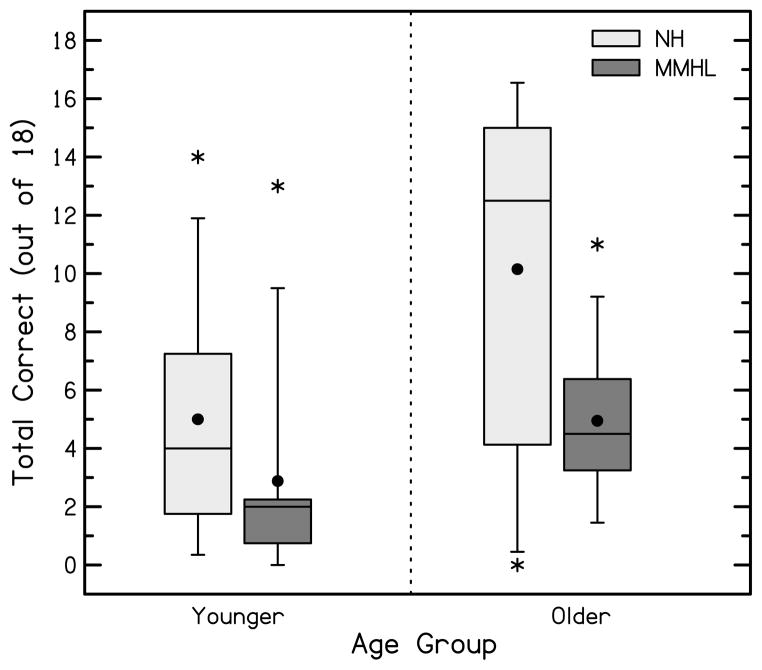
Figure 3.
Scores (total correct/18) for the comprehension task for the children with NH (light gray) and children with MMHL (dark gray). Boxes represent the interquartile range and whiskers represent the 5th and 95th percentiles. For each box, lines represent the median and filled circles represent the mean scores. Asterisks represent values that fell outside the 5th or 95th percentiles.

