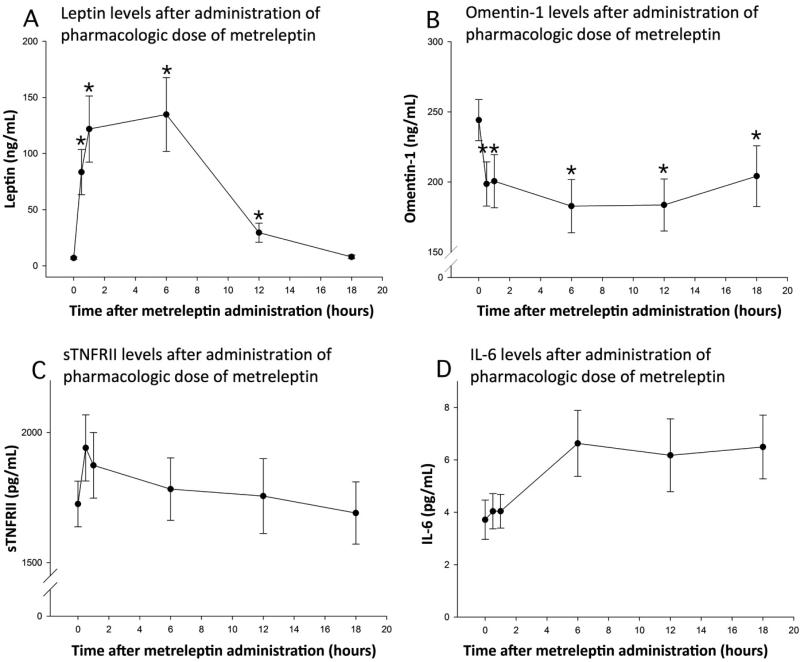
Figure 2. Study 4:Study in the fasting state with pharmacologic doses of metreleptin.
Levels of leptin (Panel A), omentin-1 (Panel B), sTNFRII (Panel C) and IL-6 (Panel D) after administration of pharmacologic dose metreleptin (0.1mg/kg). Bars indicate standard errors; stars indicate significant change when compared with baseline, p <0.05.

