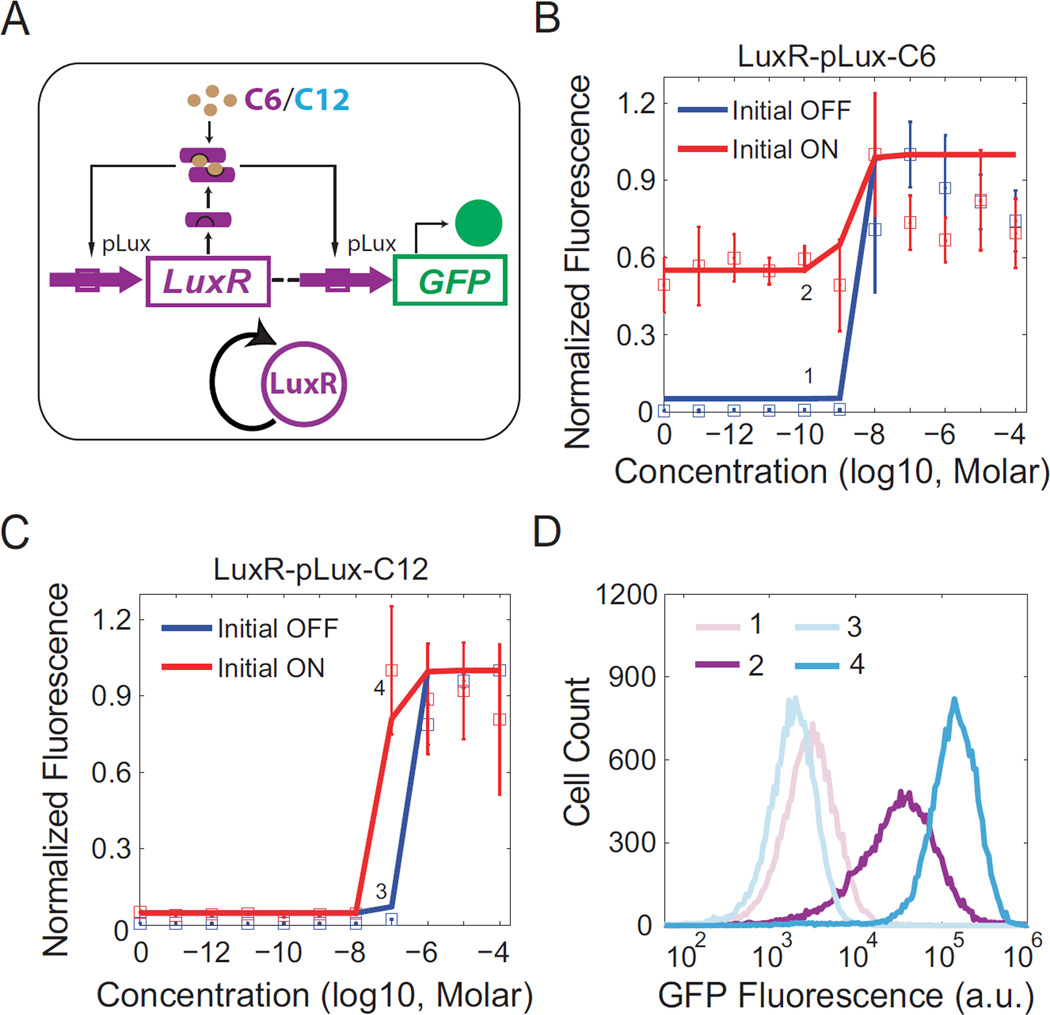
Figure 2. Signal crosstalk causes shrinkage of bistable region.
(A) Schematic diagram of a synthetic gene circuit where the pLux promoter regulates expression of LuxR, which in turn can bind with C6 or C12 to further activate pLux, forming a positive feedback loop (shown as simplified diagram). GFP under the regulation of pLux serves as the readout for LuxR levels. All components are color coded similarly as in Figure 1. (B) The average of three replicate flow cytometry measurements is plotted as a square with error bars for each dose of C6 induction, where red indicates Initial ON cells while blue denotes Initial OFF cells. Solid lines represent results calculated from model fittings. The bistable region ranges from 0 to 10−9 M C6. Labels 1 and 2 indicate representative experiments within the region to be shown as histograms in (D). (C) Similar experiments as in (B) but with C12 inductions. The bistable region ranges from 10−8 to 10−6 M C12. Labels 3 and 4 indicate representative experiments within the bistable region to be shown as histograms in (D). (D) Histograms of flow cytometry measurements labeled in (B) and (C). One representative measurement from each point is shown. No bimodal distributions are observed.

