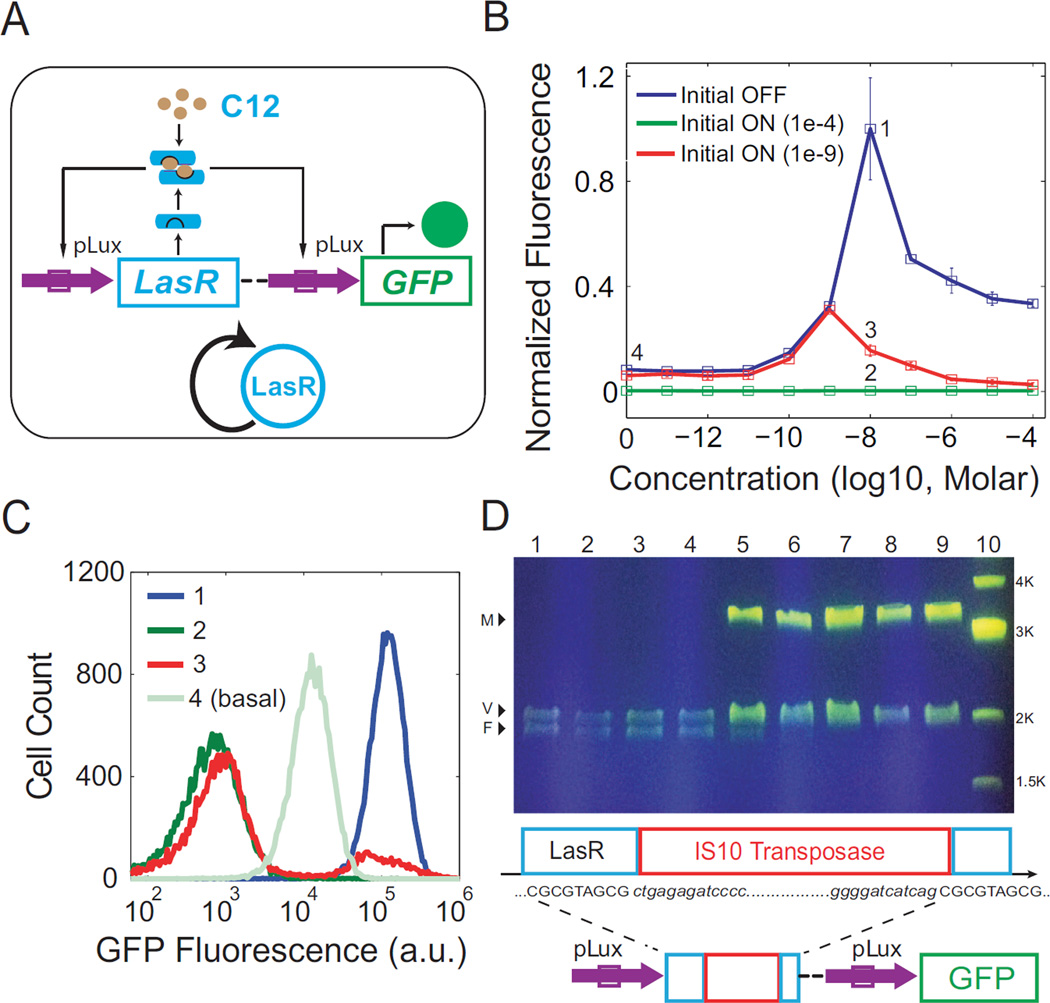
Figure 3. Promoter crosstalk induces mutation and leads to population heterogeneity.
(A) Schematic diagram of a synthetic LasR-pLux positive feedback circuit. GFP under the regulation of pLux serves as the readout for LuxR levels. All components are color coded similarly to Figure 1. (B) The average of three replicate flow cytometry measurements is plotted as a square with error bars for each dose of C12 induction. Blue denotes Initial OFF cells, while green and red indicate the Initial ON cells induced with 10−4 M C12 and 10−9 M C12 before being re-diluted into concentrations of C12, respectively. Labels 1, 2, 3, and 4 indicate experiments to be shown in detail as histograms in (C). (C) Histograms of flow cytometry measurements labeled in (B). One representative measurement from each point is shown. A bimodal distribution is only observed for label 3: which is Initial ON cells (induced with 10−9 M C12 before redilution) at 10−8 M C12. (D) DNA analysis for the Initial ON samples shown as red in (B). Top: Plasmid DNA was extracted and digested with EcoRI and PstI, and argarose gel electrophoresis results indicated gene mutation happened in samples with 10−8 M and higher doses of C12. Lane 1 is the wild-type plasmid as the control, lanes 2 to 9 are samples in 10−11 to 10−4 M C12, and Lane 10 is the 1kb DNA marker. V: vector; F: wild-type DNA fragment (the LasR-pLux positive feedback circuit); M: mutated fragment. Bottom: Schematic representation of the mutation and the features of IS10 transposase insertion: the target site (first CGCGTAGCG) in the LasR gene, its duplication (second CGCGTAGCG) due to insertion of IS10 transposase, and the IS10 sequence (red box and shown in italics).

