FIG 3.
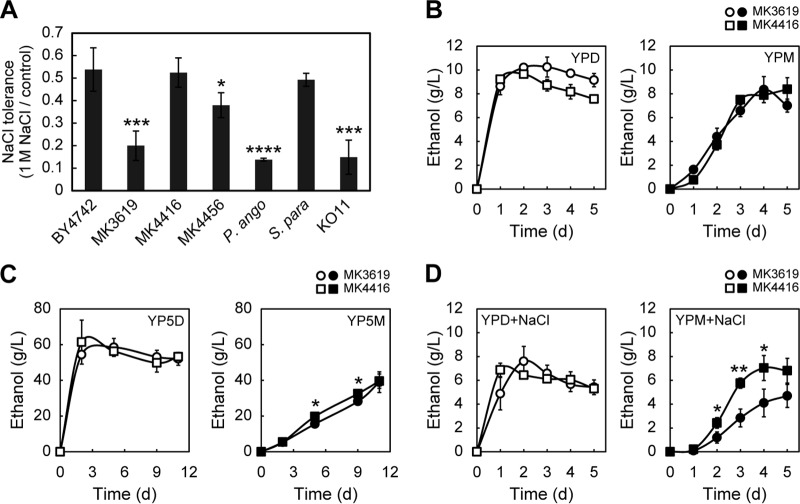
Ethanol production from mannitol using S. cerevisiae. (A) Salt tolerances of the indicated strains. The values shown are the ratios of the OD600s of salt-treated cells to those of nontreated control cells. P. ango, S. para, and KO11 represent P. angophorae, S. paradoxus NBRC0259-3, and E. coli KO11, respectively. (B to D) Ethanol production of the indicated cells. The results are means of three independent experiments, and error bars represent the SDs. (B) Strains were cultured in YPD (open symbols) or YPM (closed symbols) media. (C) Strains were cultured in YP medium containing 100 g/liter glucose (YP5D, open symbols) or 100 g/liter mannitol (YP5M, closed symbols). (D) Strains were cultured in YPD (open symbols) or YPM (closed symbols) medium containing 1 M NaCl. (A to D) Student t test determinations: *, P < 0.05; **, P < 0.01; ***, P < 0.005; and ****, P < 0.001.

