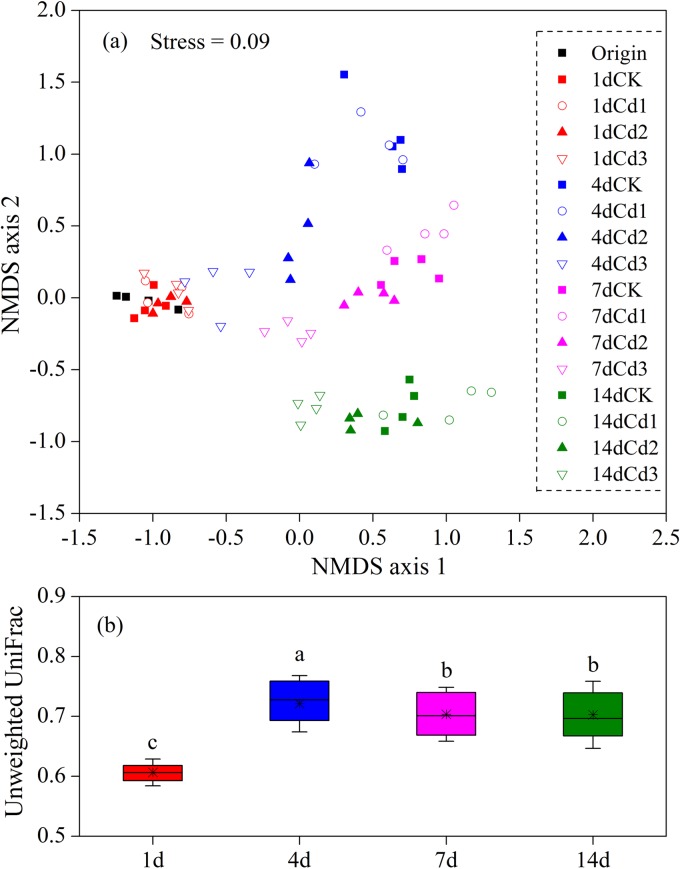
FIG 1.
(a) Nonmetric multidimensional scaling (NMDS) plots of community dissimilarities based on unweighted UniFrac distance (OTU 0.03 level) across different sampling days and Cd levels. CK represents control microcosms; Cd1, Cd2, and Cd3 represent 10, 100, and 1,000 μg liter−1 Cd-spiked microcosms, respectively. (b) Boxplots of unweighted UniFrac distance between communities within each sampling day. Lines at the top, bottom, and middle of the box correspond to the 75th, 25th, and 50th percentiles (median), respectively. Whiskers at the top and bottom of the box represent ± standard deviations (SD). The asterisk in the box represents the mean value, and means with different letters are significantly different based on least significant difference (P < 0.05).

