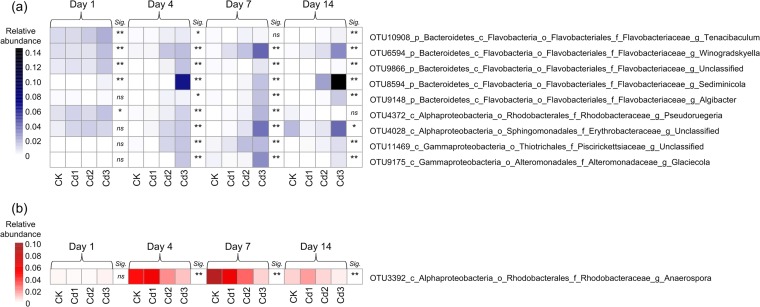
FIG 5.
Heat maps of average relative abundances of key taxa positively (a) and negatively (b) associated with Cd level across the whole duration. At each time point, significance (Sig.) is noted as follows: **, significant Pearson's correlation (P < 0.01); *, significant Pearson's correlation (P < 0.05); ns, not significant (n = 16). Taxonomy of the OTUs was identified in the Greengenes database. Refer to Fig. 1 for treatment notation.

