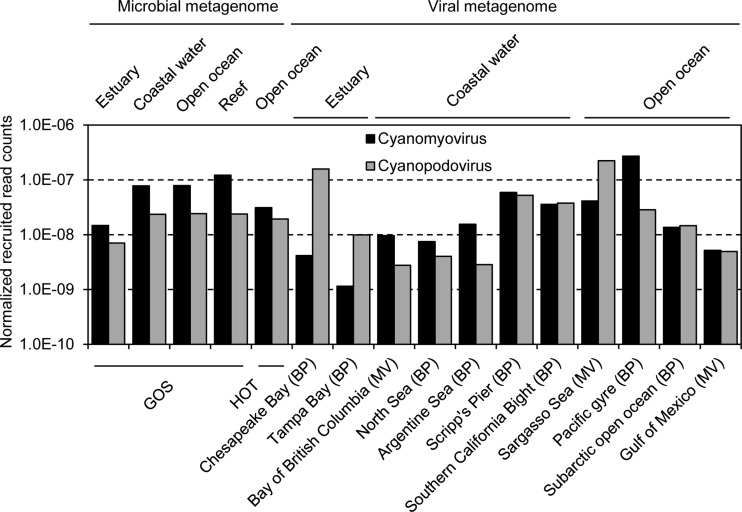
FIG 3.
Rates of occurrence of cyanopodovirus-like and cyanomyovirus-like reads in metagenomes, showing the relative abundances of cyanopodoviruses and cyanomyoviruses. Rates for the reads recruited from each type of habitat (GOS project) or each location (HOT, MarineVirome [MV], and BroadPhage [BP] projects) are shown. The absolute numbers of retrieved reads were normalized against the data sizes of metagenomes and the average genome size of cyanopodoviruses or cyanomyoviruses.

