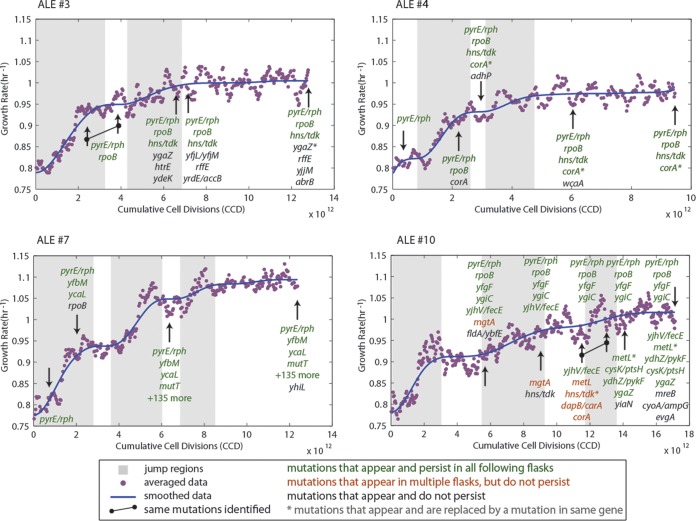
FIG 3.
Fitness trajectories of ALE experiments 3, 4, 7, and 10, along with identified jump regions and resequencing data. Shown are the fitness increases over the course of the evolution as a function of cumulative cell divisions (CCD) and the jump regions (gray boxes) identified using the outlined algorithm. Arrows indicate where colonies were isolated and resequenced. Mutation types are indicated by color: green, mutations that occurred and were found in each subsequent colony resequencing; sienna, mutations that appear in colonies from multiple flasks but not consecutively; and black, mutations that were only found in one particular clone and not in subsequent clones. Further, genetic mutations that replace a previously identified mutation in the same gene are marked with an asterisk. All of the mutations from the hypermutator strain that arose in experiment 7 are not shown (more than 135 total mutations). Plots for all nine experiments are given in Fig. S1 in the supplemental material. Note that genetic expressions in Fig. 3 and in subsequent figures that incorporate a shill (/), such as “pyrE/rph”, refer to intergenic regions, e.g., “pyrE/rph” refers to the pyrE-rph intergenic region.

