
FIG 5.
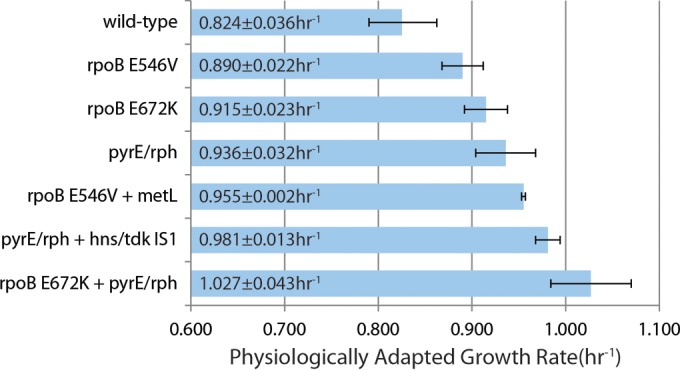
Causal mutation analysis. Shown is a bar graph of the physiologically adapted growth rates of strains harboring key mutations identified in the present study. The error bars represent 95% confidence intervals from three biological replicates. These results show that the mutation in metL and the IS1 insertion between hns and tdk are causal in the presence of the additional mutations shown. The strain with metL also had one additional mutation, but this was not observed in any other sequenced metL mutant from the ALE experiment. It is clear from the fastest growing mutant, with a growth 1.3-fold greater than the wild type, how significantly the pyrE-rph intergenic region and rpoB gene mutations can affect growth rate. “pyrE/rph” refers only to the 82-bp deletion.