
FIG 6.
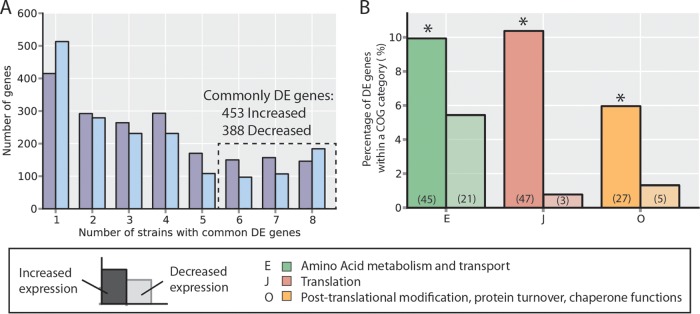
Commonly differentially expressed (DE) genes. (A) Numbers of differentially expressed genes (with respect to the wild-type strain) common across evolved strains. Increased- and decreased-expression genes are counted separately to ensure the direction of change is conserved across strains. The y axis indicates the number of genes differentially expressed in exactly the number of strains indicated on the x axis. From this, 453 increased-expression and 388 decreased-expression genes are identified as common to at least six strains, whereas one would expect no genes in common to all six by random chance (see Fig. S6 in the supplemental material; see also Materials and Methods). (B) The functions of commonly differentially expressed genes for both the increase-expression and decreased-expression sets were interrogated using annotated clusters of orthologous groups (COGs). The groups shown are those which were overrepresented in either the increased or decreased DE gene sets as identified with a hypergeometric test (P < 0.05; *, overrepresented; see Materials and Methods). The percentage of DE genes that fell in each of the overrepresented COG categories is indicated by the bar height, and the total number of DE set genes anotated with that COG function is indicated in parentheses (e.g., 45/453 = 9.9% and 21/388 = 5.4%).