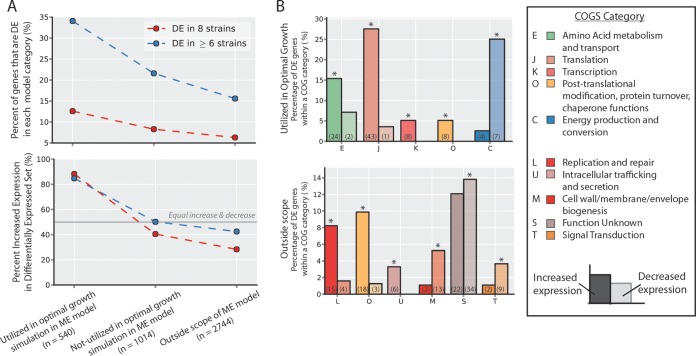
FIG 7.
Comparison of genome-scale modeling predictions and categorization of commonly differentially expressed (DE) genes. (A) Commonly differentially expressed genes (n = 841) were compared to a gene classification obtained by using a genome-scale model of E. coli (38). The growth rate was optimized using the model under the same glucose aerobic batch conditions as those used in the ALE experiment. Simulation results were used to classify genes (x axis). Overall, differentially expressed genes are more enriched in the set predicted to enable an optimal growth phenotype (top). Furthermore, within the differentially expressed set of genes, genes predicted to enable an optimal growth phenotype are more often upregulated than downregulated (bottom), and DE genes outside the scope of the model were more often decreased. (B) Using a combination of the increased and decreased DE gene sets and the in silico-predicted gene classification (see Fig. S7 in the supplemental material), subsets of genes could be identified that enabled the observed optimal states of the evolved strains at the functional level. This was accomplished by using COG categories as for Fig. 6B. The percentage of DE genes that fell in each of the overrepresented COG categories in either the increased- or decreased-expression set is indicated by the bar height, and the total number of DE set genes annotated with that COG function is indicated in parentheses.

