FIG 2.
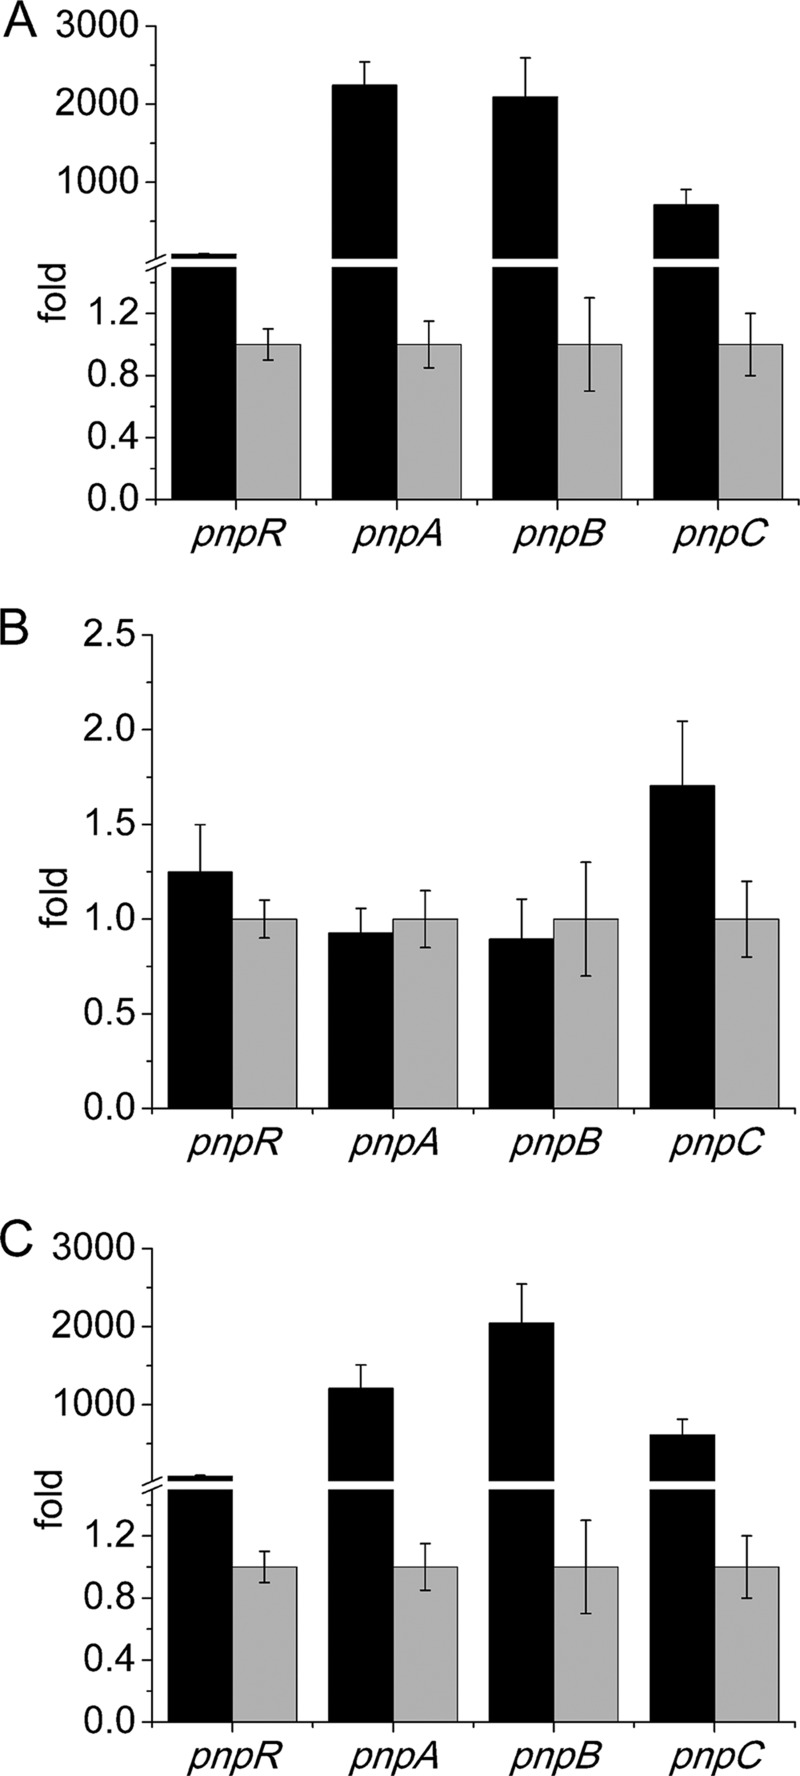
Transcriptional analysis of pnpA, pnpB, pnpCDEFG, and pnpR operons in the wild-type strain WBC-3 (A), pnpR knockout strain WBC3-ΔpnpR (B), and the complemented pnpR knockout strain WBC3-pnpRC (C), in the presence and absence of PNP. RNA samples were isolated from the above three strains grown on LB plus MM (1:4, vol/vol) with 3 h of induction with PNP or without PNP. qRT-PCR was manipulated as described in the Materials and Methods section. The levels of gene expression in each sample were calculated as the fold expression ratio after normalization to 16S rRNA gene transcriptional levels. The values are averages of three independent qRT-PCR experiments. Error bars indicate standard deviations. There was a significant difference in the transcription levels of pnpA, pnpB, pnpC, and pnpR between strains WBC3-ΔpnpR and WBC3-pnpRC (P < 0.001, paired-sample test). Changes (fold) in gene expression levels in the presence (black) and absence (gray) of induction with PNP are indicated.

