Figure 16.

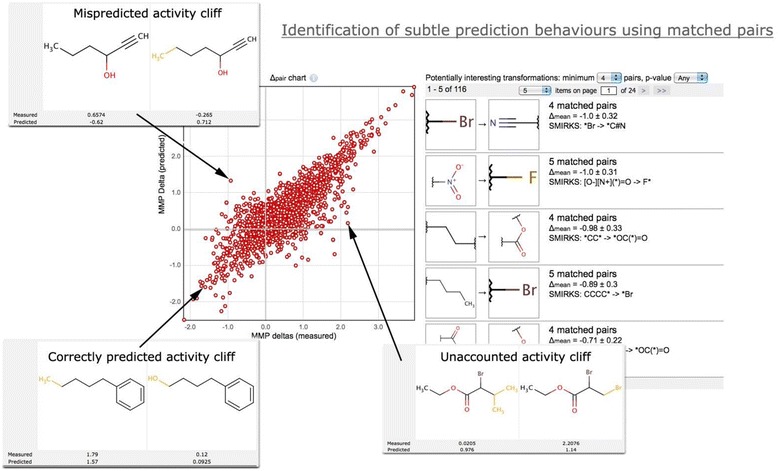
A delta-pair chart for an aquatic toxicity model. Three representative cases of activity cliffs are shown. The right part shows the significant transformations for aquatic toxicity.

A delta-pair chart for an aquatic toxicity model. Three representative cases of activity cliffs are shown. The right part shows the significant transformations for aquatic toxicity.