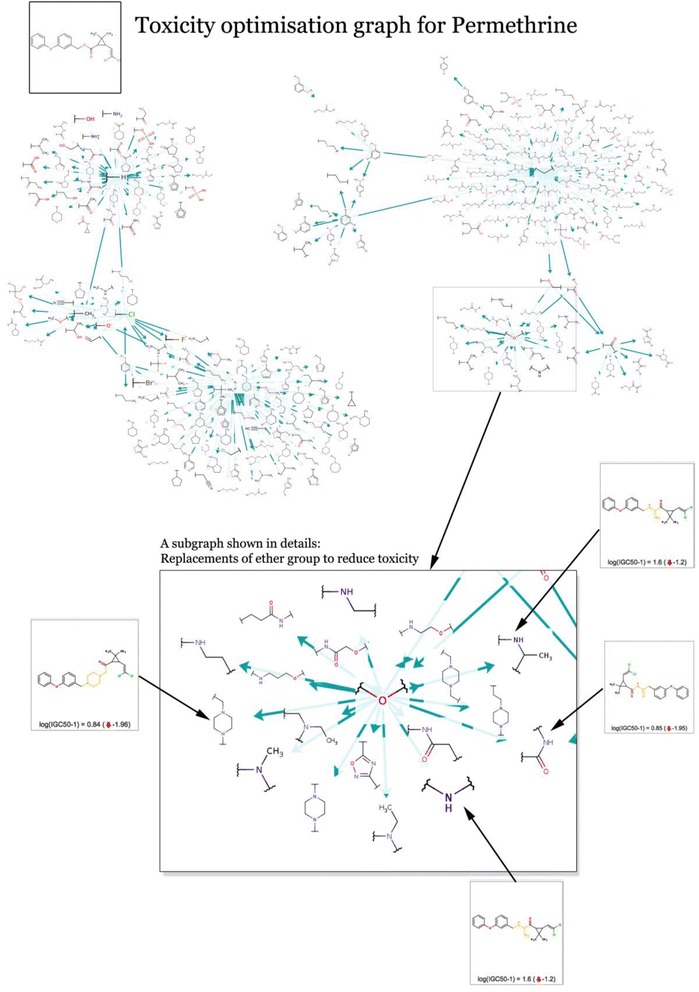
Figure 5.

Transformation graph for Permethrin optimization. Graph of the transformations that affect the aquatic toxicity of the Permethrin molecule. The graph includes 393 transformations that provide replacements of several structural groups by less toxic variants. A cluster with replacements of ether groups is shown in detail together with a few examples of optimized molecules.
