
Figure 7.
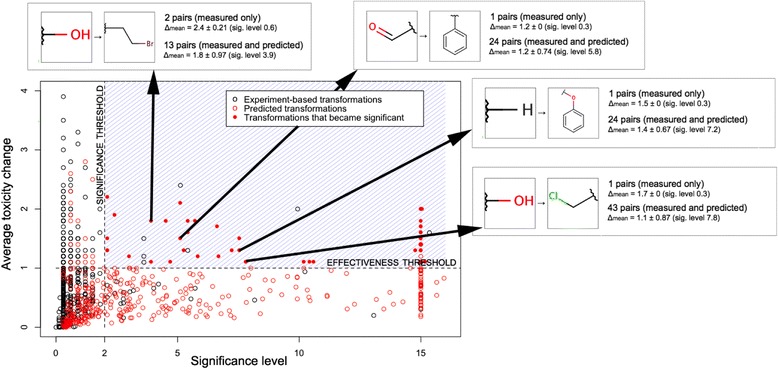
Toxicity optimization: statistically and practically significant transformations. The chart shows interesting transformations that are both statistically significant (significance level >2, p-value <0.01) and effective (mean toxicity change at least one log unit). A number of transformations that did not have sufficient measured pairs became significant when combined with predicted pairs (were “amplified”, shown as solid red circles).