
Figure 3.
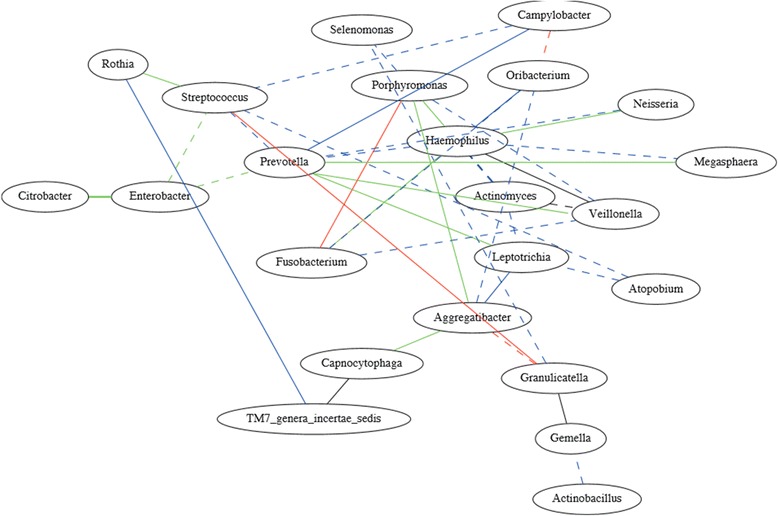
Partial correlation network constructed by the frequency abundance of 28 common genera (frequency >0.5% in at least one regional groups) in 152 individuals from Alaska, Germany, and Africa. In this figure, the solid lines represent positive correlations, and the dashed lines represent negative correlations. The line color indicates the shared correlation between different groups; green: correlation shared between Alaskans and Africans, blue:correlation shared between Alaskans and Germans, red: correlation shared between Germans and Africans, black: correlations shared among all three groups.