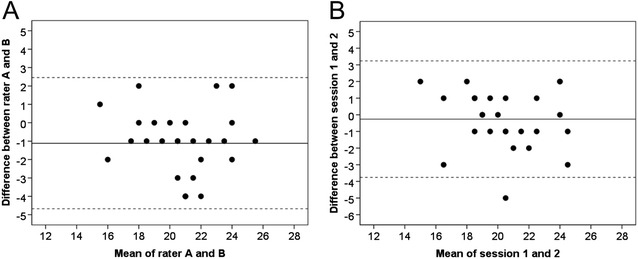
Figure 1.

Bland & Altman graphs presenting the Mini-BESTest for inter-rater (A) and test-retest (B) reliability. (A) The difference between rater A and B is plotted against the mean of rater A and B. (B) The difference between test session 1 and 2 is plotted against the mean of the two sessions. The solid line represents the mean difference between the two tests and the dotted line two standard deviations (limits of agreement).
