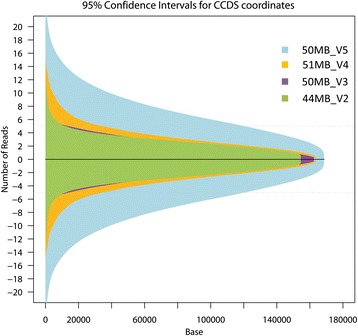
Figure 4.

Inter-sample variability of observed read depths. Plot of the 95% confidence interval per captured CCDS base across samples for the Agilent 44MB_V2 (green) 50MB_V3 (purple), 51MB_V4 (orange), and 50MB_V5 (blue) capture kits. For V2, V3, and V4 kit versions, over 86% of captured bases varied less than ±5 reads between samples, with the largest variation coming at higher read depths. Given that V5 had only six exomes, the variability is more pronounced due to the small sample size, however, over 85% of captured bases varied by more than ±10 reads between samples. The largest variability was seen at higher read depths (>30X). The depth of sequencing and version of the capture kit did not affect inter-sample variability.
