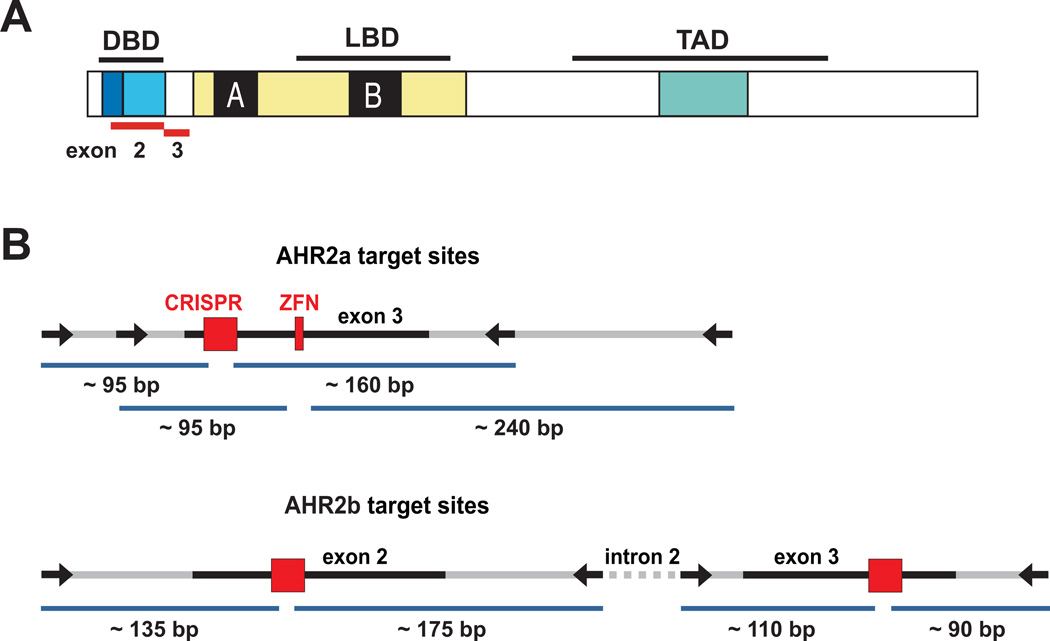
Figure 2.
AHR target sites. A. Functional domain structure of the AHR protein. The location of the targeted exons 2 and 3 in relation to the functional domains is shown as red bars. DBD: DNA-binding domain, LBD: ligand-binding domain, TAD: transcriptional activation domain. B. Schematic representations of the ZFN and CRISPR-Cas target regions in AHR2a and AHR2b loci. Arrows represent the primers used in the PCR amplification of genomic DNA for screening. Surveyor nuclease fragments are shown below the target regions.

