
Figure 5. Quantified colonic distribution of MAP and MPP after rectal administration to mice.
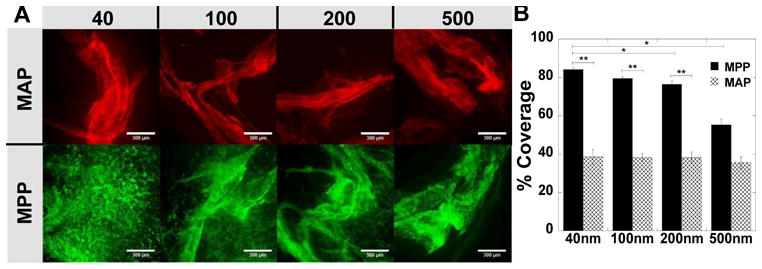
Distribution on flattened colonic tissue after rectal administration of 40, 100, 200, and 500 nm (A) MAP (red) or MPP (green). (B) Quantified surface coverage of various sized MAP and MPP on flattened mouse colonic tissue. Images are representative of n ≥ 3 mice and 6 images per tissue. White scale bars indicate 300 μm. Data are calculated as means ± SEM. *P < 0.05 as compared to MAP, Student's t-test.