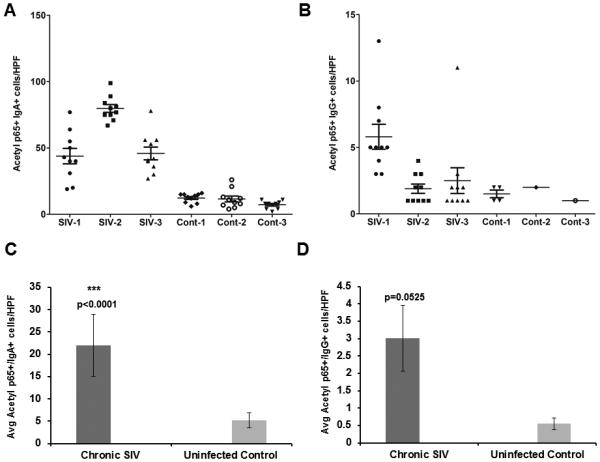
FIGURE 8.

Quantification of the number of IgA/acetylated-p65++ (A) and IgG/acetylated-p65++ (B) in the lamina propria of 3 chronic SIV-infected and 3 control rhesus macaques. Positive cells were counted at an original magnification of 40X in 10 high power fields (HPF). One HPF= 0.2827 mm2. Each data point represents the number of cells in a single HPF; the error bars represent the mean values. Average IgA/acetylated-p65++ (C) and IgG/acetylated-p65++ (D) in the colonic lamina propria of 3 SIV-infected and 3 uninfected control macaques. All slides were analyzed by two investigators in a blinded manner. Data was analyzed using Wilcoxon’s rank sum test. Triple asterisks (***) indicate statistical significance (p< 0.0001) compared to uninfected controls.
