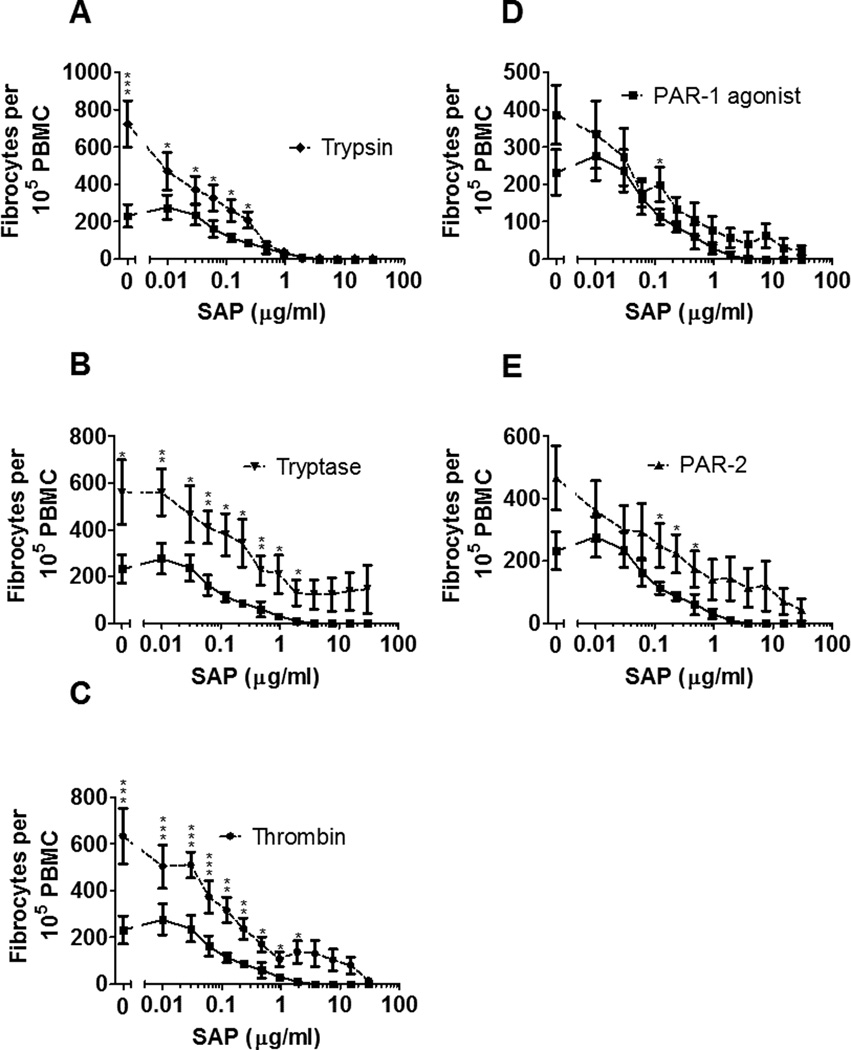
Figure 7. Tryptase and thrombin alter SAP’s IC50.
PBMC were co-incubated with the indicated concentrations of SAP and 12.5 ng/ml (A) trypsin, (B) tryptase, (C) thrombin, or 10 µM (D) PAR-1 agonist or (E) PAR-2 agonist. After 5 days, fibrocytes were counted as in Figure 1. In A-E, the lower curve is SAP alone. Values are mean ± SEM, n=6. * indicates p < .05, ** p < .01, and *** p < .001 compared to the no-protease or no-agonist control (Mann-Whitney test).

