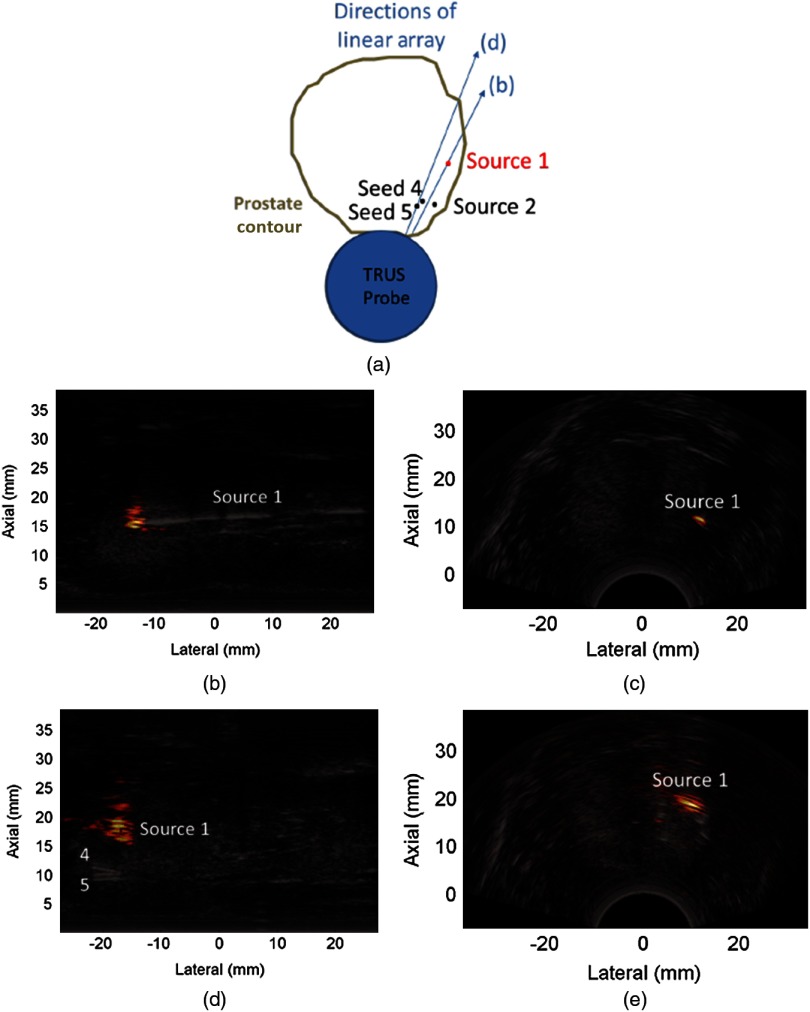
Fig. 6.
(a) Schematic diagram of implanted seeds relative to the light source and TRUS probe with direction labels that correspond with the linear images in this figure. DAS photoacoustic images (overlaid on ultrasound B-mode images) showing fiber-related artifacts when the probe was placed to visualize the fiber tip (Source 1) with the (b) linear and (c) curvilinear arrays. Corresponding artifacts associated with Source 1 when the probe was (d) rotated and (e) translated away from the fiber tip. Source 2 was not yet inserted when these ultrasound and photoacoustic images were acquired.

