
Figure 5.
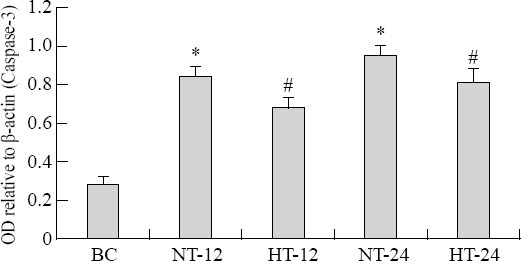
Caspase-3 mRNA expression in nerve cells of the hippocampus in each group. The data of β-actin were normalized. The fold changes of caspase-3mRNA were calculated in the BC group, and the results are presented as the mean fold of the blank control±SD. *P<0.05 vs. the BC group; #P<0.05 vs. the NT group. HT: mild hypothermia group; NT: normothermia group; BC: blank control group.