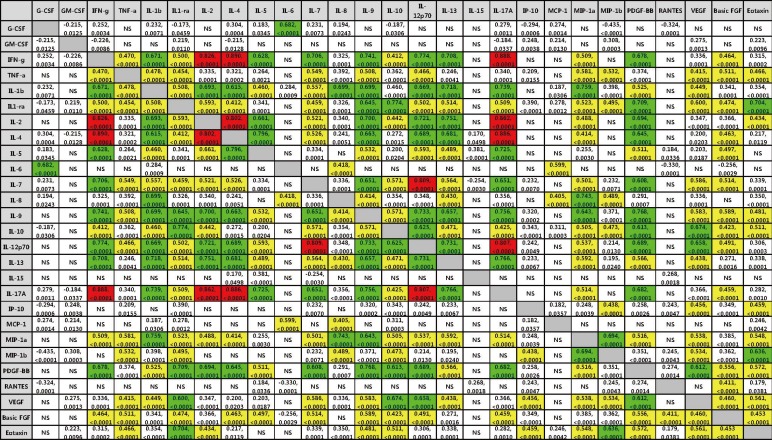
Fig. 1.
Correlations among 27 cytokines in the serum samples of burn patients (n=134). Correlation coefficients (r) corresponding to significant correlations (P<0.05) are presented. Upper line number in each box indicates correlation coefficient (r) and lower line number indicates P value. Red color indicates the strongest correlation (r>0.8) and green color (0.6<r≤0.8) and yellow color (0.4<r≤0.6) indicates stronger correlation.
Abbreviation: NS, not-significant.

