
Table 3.
Serum concentrations of various cytokines in burn patients according to postburn time and survival status
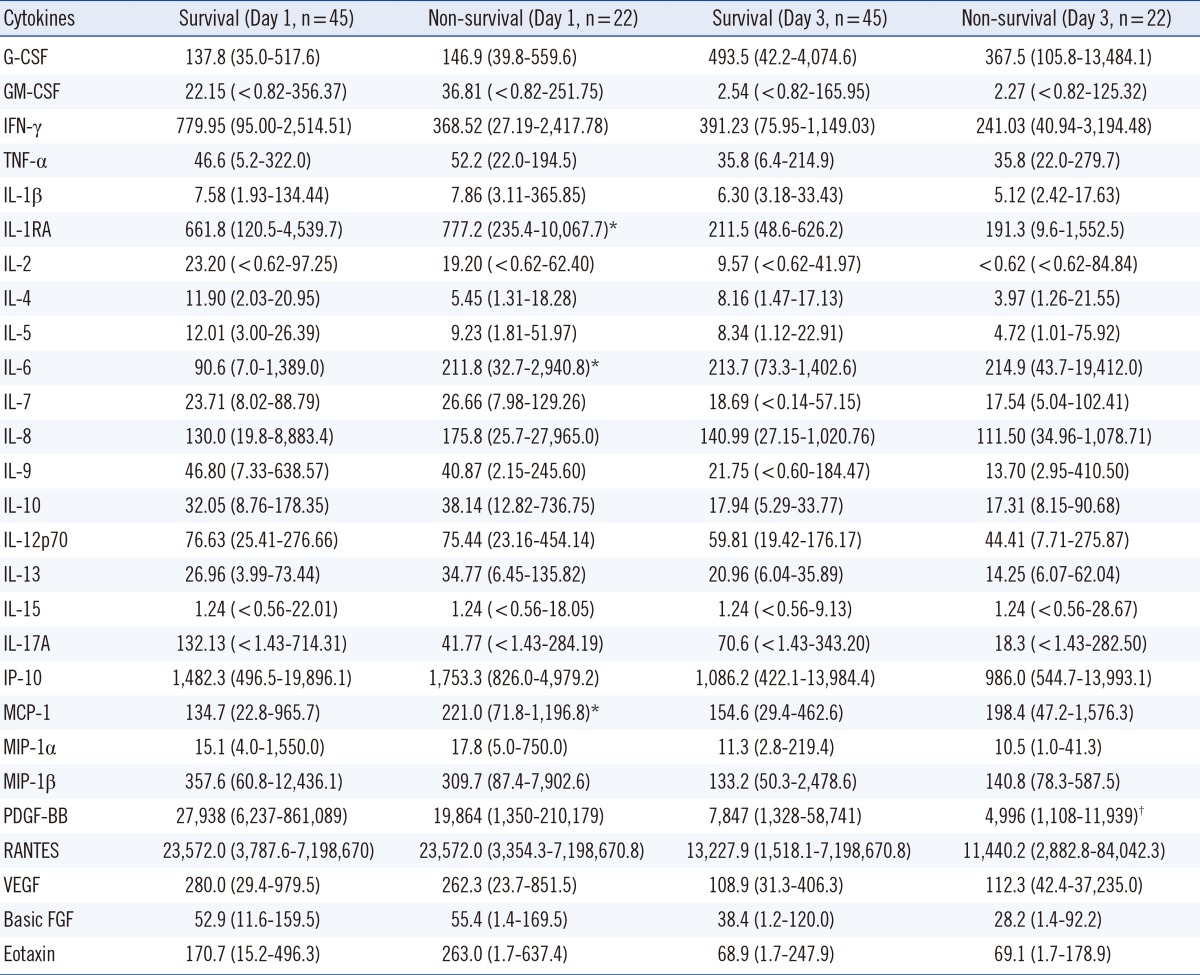
Data were expressed median (range) pg/mL.
*Significant increase in non-survival group compared to survival group (P<0.05); †Significant decrease in non-survival group compared to survival group (P<0.05).