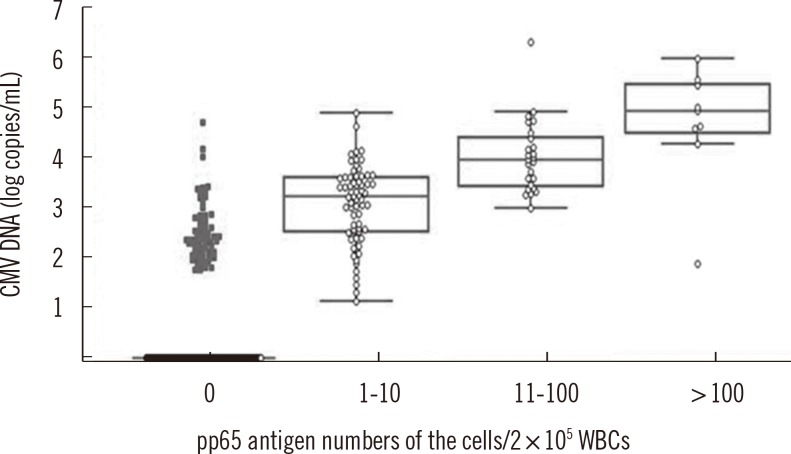
Fig. 2.
Evaluation of cytomegalovirus (CMV) DNA in whole blood samples for different groups of pp65-antigenemia (Pearson's correlation coefficient; n=156, r=0.3877, P=0.0013). The CMV DNA load was plotted for four pp65-antigenemia groups. For each pp65 group, the median CMV DNA load (log10 copies/mL), the interquartile 50% range, and the range of values are represented. Abbreviation: WBC, white blood cell.

