
Table 2.
Total and physical activity energy expenditure and dietary energy intake in each group at the baseline and during the 12 weeks intervention (kcal/day)
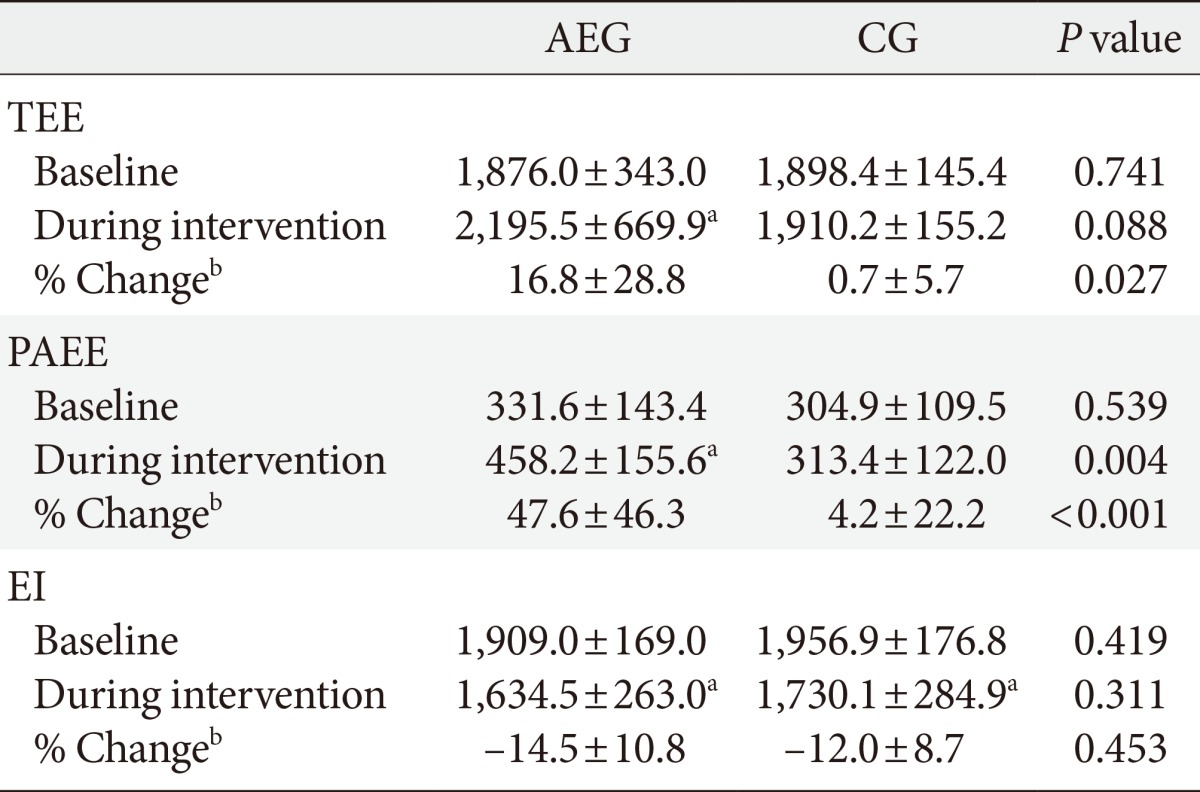
Values are presented as mean±standard deviation. P values are obtained by independent t-test.
AEG, aerobic exercise group; CG, control group; TEE, total energy expenditure; PAEE, physical activity energy expenditure; EI, energy intake.
aP<0.05 compared to baseline within group, bChange (percent change) was calculated as (12 weeks value-baseline value)×100/baseline value