Abstract
We aimed to estimate the cutoff value of glycated hemoglobin (HbA1c, A1c) for fasting plasma glucose (FPG) of 126 mg/dL in the Korean adult population, using the 2011 Korea National Health and Nutrition Examination Survey. A total of 5,421 participants without a history of diabetes and over 19 years of age were included in the analysis. A point-wise area under the receiver operating characteristic curve was used to estimate the optimal A1c cutoff value. A1c threshold of 6.1% produced the highest sum of sensitivity (85.2%) and specificity (90.5%) for FPG of 126 mg/dL (area under the curve, 0.941, P<0.001). A1c of 6.5% produced a sensitivity of 67.7% and specificity of 98.0% for FPG of 126 mg/dL. Considering A1c as one of three criteria for the diagnosis of diabetes and the specificity of an A1c cutoff of 6.5%, the current diagnostic criteria of A1c≥6.5% might be acceptable in the Korean adult population.
Keywords: Diabetes mellitus; Diagnosis; Hemoglobin A, glycated
INTRODUCTION
The diagnosis of diabetes has been based on the fasting plasma glucose (FPG) level or the 2-hour plasma glucose (2HPG) level after an oral glucose tolerance test (OGTT). The American Diabetes Association recommends a glycated hemoglobin (HbA1c, A1c) ≥6.5% as one of the criteria for the diagnosis of diabetes [1]. However, the optimal A1c threshold is in debate. We estimated the cutoff value of A1c for FPG of 126 mg/dL in the Korean adult population, using data from the 2011 Korea National Health and Nutrition Examination Survey (KNHANES V-2).
METHODS
KNHANES V-2 is a national probability survey conducted since 1998 by the Korean Center for Disease Control for Health Statistics at 192 survey locations to survey the health and nutritional status of the civilian, non-institutionalized Korean population. In the KNHANES V-2, an annual total of 3,840 households were selected. A total of 10,589 people participated in the KNHANES V-2 in 2011. The participation rate for the health examination was 76.1%. Among these subjects, 6,686 participated in the laboratory examination. After exclusion of the participants who were <19 years old (n=785) and those previously diagnosed with diabetes (n=480), 5,421 participants were included for the analysis.
The blood samples were obtained after a minimum fasting time of 8 hours. The FPG analysis was performed using a Hitachi Automatic Analyzer 7600 (Hitachi, Tokyo, Japan). The A1c was measured using a high performance liquid chromatography method (HLC-723G7; Tosoh, Tokyo, Japan). The detailed methods for comparing and verifying the validity and reliability of each survey are described elsewhere [2].
This study was approved by the Institutional Review Board of Inje University Ilsan Paik Hospital, Korea (IB-2-1312-054). After the approval of the study proposal, the KNHANES dataset was made available at the request of the investigator. Because the dataset did not include personal information and the participants' consent had been given in the KNHANES, our study was exempted from participant consent by the review board.
A point-wise area under the receiver operating characteristic (ROC) curve was used to evaluate the diagnostic accuracy of the A1c cutoff. Sensitivity was defined as the proportion of subjects with a given risk factor who were identified correctly by an A1c value greater than or equal to the cutoff point. Specificity was defined as the proportion of subjects without the risk factor who were correctly identified with an A1c value below the cutoff point. The area under the ROC curve was calculated, and by interpolation from the area under the curve, the point closest to the upper left-hand corner was selected as the optimal cutoff point. The positive predictive value (PPV) and negative predictive value (NPV) for every cutoff point were calculated.
We used all of the P values as two sided and considered P<0.05 as statistically significant. The statistical analyses were performed using SPSS version 18.0 (SPSS Inc., Chicago, IL, USA).
RESULTS
The study participants included 2,288 men and 3,133 women. The mean age was 49 years old (range, 19 to 97), and the clinical characteristics were as follows: body mass index, 23.6±3.4 (mean±SD) kg/m2; waist circumference 81±10.1 cm; systolic blood pressure, 118.2±17.0 mm Hg; diastolic blood pressure, 75.8±10.4 mm Hg; FPG 94.2±15.7 mg/dL; and A1c, 5.6%±0.6%, including 4,189 participants with a normal fasting glucose level (FPG <100 mg/dL), 1,077 with an impaired fasting glucose level (100≤FPG<126 mg/dL), and 155 with diabetes (FPG ≥126 mg/dL).
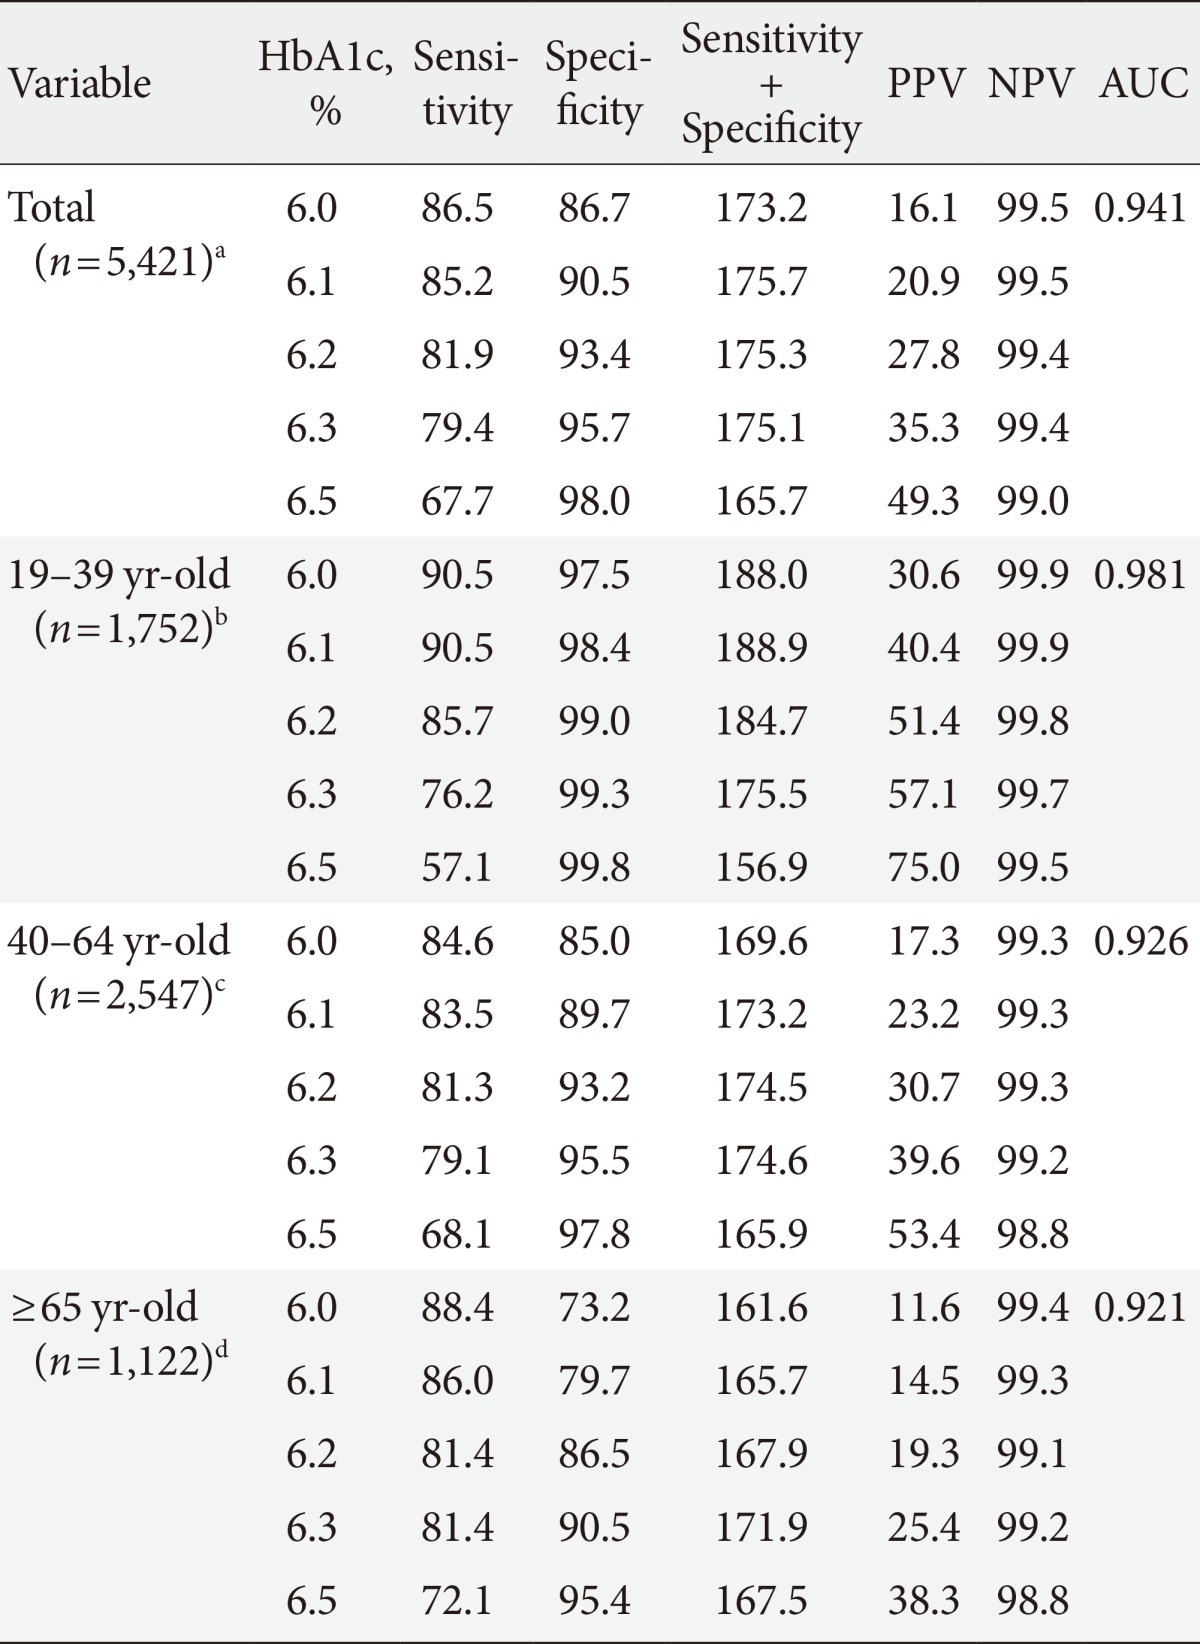
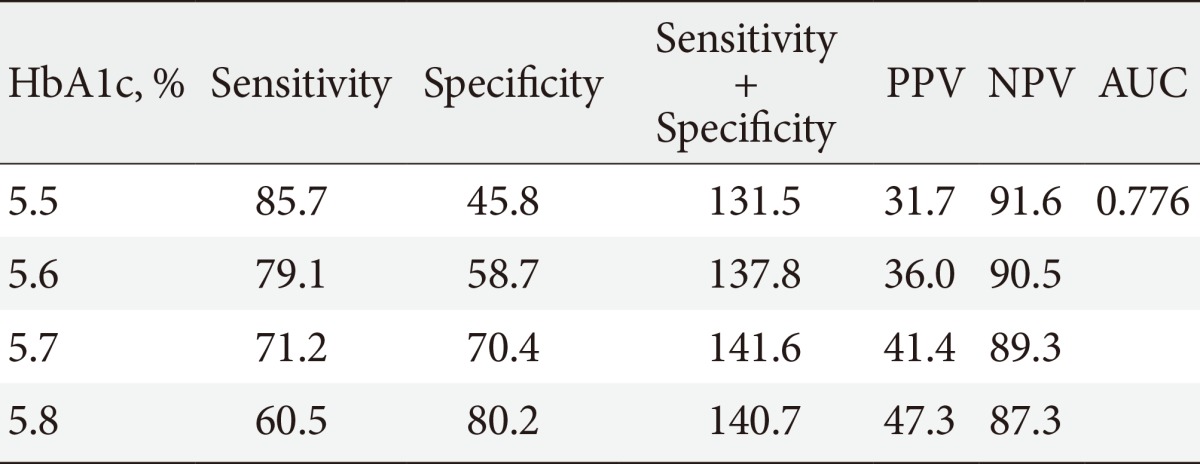
The sensitivity and the specificity of various A1c cutoff values for FPG of 126 mg/dL in the total population, after stratification by age, are shown in Table 1. An A1c threshold of 6.1% was shown to be the optimal limit for FPG of 126 mg/dL, with 85.2% sensitivity and 90.5% specificity (area under the curve, 0.941; P<0.001). An A1c cutoff of 6.5% produced a sensitivity of 67.7% and a specificity of 98.0% for FPG of 126 mg/dL. The A1c cutoff increased with age (6.1% in participants 19 to 39 years of age; 6.3% in participants 40 to 64 years; and older than 65 years of age). An A1c cutoff of 5.7% produced the highest sum of sensitivity (71.2%) and specificity (70.4%) for FPG of 100 mg/dL (Table 2).
Table 1.
Sensitivities and specificities of different HbA1c levels for FPG ≥126 mg/dL

FPG, fasting plasma glucose; PPV, positive predictive value; NPV, negative predictive value; AUC, area under the curve.
Number of patients with FPG ≥126 mg/dL, an=155, bn=21, cn=91, dn=43.
Table 2.
Sensitivities and specificities of different HbA1c levels for FPG ≥100 mg/dL

FPG, fasting plasma glucose; PPV, positive predictive value; NPV, negative predictive value; AUC, area under the curve.
DISCUSSION
One Korean cross-sectional study including 4,616 adults without a history of diabetes showed that an A1c of 6.1% was the optimal limit for diagnosing diabetes, with 63.8% sensitivity and 88.1% specificity, 72.4% PPV and 79.5% NPV, with diabetes criteria of FPG ≥126 mg/dL and/or 2HPG of a 75-g OGTT ≥200 mg/dL [3]. In this study, an A1c cutoff of 6.5% produced a sensitivity of 50.5%, specificity of 95.0%, PPV of 87.1%, and NPV of 74.2% for diabetes. In the Ansung-Ansan cohort study, an A1c of 5.9% produced the highest sum of sensitivity (68%) and specificity (91%) for the development of diabetes with diabetes criteria of FPG ≥126 mg/dL and/or 2HPG of a 75-g OGTT ≥200 mg/dL [4]. In the baseline of this study, an A1c cutoff of 5.9% produced the maximum sum of sensitivity (68%) and specificity (91%) by an ROC analysis (PPV, 34%; NPV, 98%). The results of this study are consistent with those of a large meta-analysis [5], which reported that an A1c level of 6.1% had a sensitivity and specificity of 78% to 81% and 79% to 84%, respectively. Additionally, our findings are in accord with those of the Rancho Bernardo Study (6.15%) [6], an Australian study (6.2%) [7], a Chinese study (6.1%) [8], and an Indian study (6.1%) [9].
Our data demonstrate that older individuals have higher A1c levels than younger individuals with similar FPG profiles. This result is in agreement with those of a previous Korean study [3], which found that the appropriate A1c cutoff value rose by approximately 0.1%/decade of subject age. Another study [10] investigated the effect of age on the A1c level in the nondiabetic subjects enrolled in the Framingham Offspring Study and the nondiabetic participants in the NHANES 2001 to 2004 survey and found a 0.10% to 0.14% increase/decade. A possible explanation for the observed association of higher A1c with increasing age is related to changes in the rate of glycation associated with aging [11].
Several limitations of this study should be acknowledged. First, the survey was based on cross-sectional data. Second, 2HPG was not included in this analysis. Although practically, an OGTT could not be performed in the total general population in this national survey, the lack of 2HPG could be one of the possible explanations for the very low PPV (20.9%) for the A1c of 6.1% in this study. The last limitation is the lack of data regarding the diabetic complications in this study, which are the most important parameters for defining the criteria of diabetes.
It is rarely possible in screening tests to obtain both high sensitivity and specificity. Considering that the A1c is not the only criterion for diabetes, the specificity of the A1c cutoff is undoubtedly more important than the sensitivity. The high prevalence of diabetes in the general population is another reason that a cutoff level should have high specificity rather than sensitivity, to prevent a significant number of false positives. Considering that the PPV of an A1c level of 6.1% for FPG of 126 mg/dL was very low, the A1c level ≥6.1% might be appropriate for the diagnosis of diabetes. The significance of this study is that we observed findings in a national representative sample of the Korean adult population that are similar to those reported previously in several Korean cohort studies. Considering A1c as one of three criteria for the diagnosis of diabetes and the high specificity of an A1c cutoff of 6.5%, the current diagnostic criteria of A1c ≥6.5% might be acceptable in the Korean adult population.
ACKNOWLEDGMENTS
JMK, JCW, and DJK researched the data and wrote the manuscript. JWH, JHN, KSK, and BDR contributed to the discussion and reviewed/edited the manuscript.
Footnotes
No potential conflict of interest relevant to this article was reported.
References
- 1.American Diabetes Association. Diagnosis and classification of diabetes mellitus. Diabetes Care. 2010;33(Suppl 1):S62–S69. doi: 10.2337/dc10-S062. [DOI] [PMC free article] [PubMed] [Google Scholar]
- 2.Korea Centers for Disease Control and Prevention (KCDC) Korea National Health and Nutrition Examination Survey. [updated 2013 Jun 27]. Available from: http://knhanes.cdc.go.kr.
- 3.Lee H, Oh JY, Sung YA, Kim DJ, Kim SH, Kim SG, Moon S, Park Ie B, Rhee EJ, Chung CH, Kim BJ, Ku BJ. Optimal hemoglobin A1C cutoff value for diagnosing type 2 diabetes mellitus in Korean adults. Diabetes Res Clin Pract. 2013;99:231–236. doi: 10.1016/j.diabres.2012.09.030. [DOI] [PubMed] [Google Scholar]
- 4.Choi SH, Kim TH, Lim S, Park KS, Jang HC, Cho NH. Hemoglobin A1c as a diagnostic tool for diabetes screening and new-onset diabetes prediction: a 6-year community-based prospective study. Diabetes Care. 2011;34:944–949. doi: 10.2337/dc10-0644. [DOI] [PMC free article] [PubMed] [Google Scholar]
- 5.Bennett CM, Guo M, Dharmage SC. HbA(1c) as a screening tool for detection of type 2 diabetes: a systematic review. Diabet Med. 2007;24:333–343. doi: 10.1111/j.1464-5491.2007.02106.x. [DOI] [PubMed] [Google Scholar]
- 6.Kramer CK, Araneta MR, Barrett-Connor E. A1C and diabetes diagnosis: the Rancho Bernardo Study. Diabetes Care. 2010;33:101–103. doi: 10.2337/dc09-1366. [DOI] [PMC free article] [PubMed] [Google Scholar]
- 7.Lu ZX, Walker KZ, O'Dea K, Sikaris KA, Shaw JE. A1C for screening and diagnosis of type 2 diabetes in routine clinical practice. Diabetes Care. 2010;33:817–819. doi: 10.2337/dc09-1763. [DOI] [PMC free article] [PubMed] [Google Scholar]
- 8.Hu Y, Liu W, Chen Y, Zhang M, Wang L, Zhou H, Wu P, Teng X, Dong Y, Zhou J, Xu H, Zheng J, Li S, Tao T, Hu Y, Jia Y. Combined use of fasting plasma glucose and glycated hemoglobin A1c in the screening of diabetes and impaired glucose tolerance. Acta Diabetol. 2010;47:231–236. doi: 10.1007/s00592-009-0143-2. [DOI] [PubMed] [Google Scholar]
- 9.Kumar PR, Bhansali A, Ravikiran M, Bhansali S, Dutta P, Thakur JS, Sachdeva N, Bhadada SK, Walia R. Utility of glycated hemoglobin in diagnosing type 2 diabetes mellitus: a community-based study. J Clin Endocrinol Metab. 2010;95:2832–2835. doi: 10.1210/jc.2009-2433. [DOI] [PubMed] [Google Scholar]
- 10.Pani LN, Korenda L, Meigs JB, Driver C, Chamany S, Fox CS, Sullivan L, D'Agostino RB, Nathan DM. Effect of aging on A1C levels in individuals without diabetes: evidence from the Framingham Offspring Study and the National Health and Nutrition Examination Survey 2001-2004. Diabetes Care. 2008;31:1991–1996. doi: 10.2337/dc08-0577. [DOI] [PMC free article] [PubMed] [Google Scholar]
- 11.Kilpatrick ES, Dominiczak MH, Small M. The effects of ageing on glycation and the interpretation of glycaemic control in type 2 diabetes. QJM. 1996;89:307–312. doi: 10.1093/qjmed/89.4.307. [DOI] [PubMed] [Google Scholar]


