
Fig. 3.
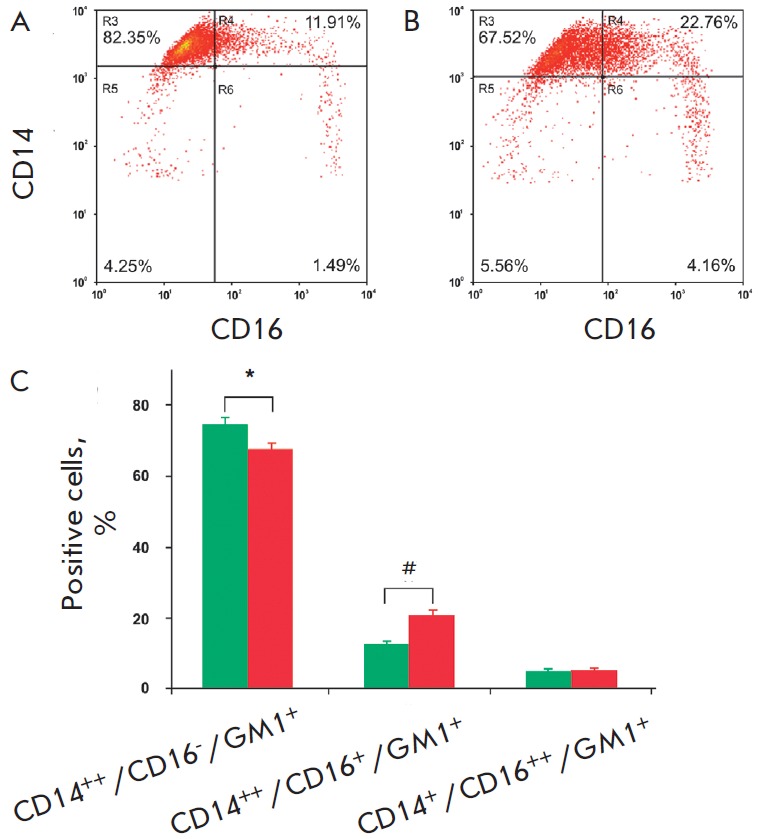
Monocyte subsets from healthy subjects and atherosclerotic patients. Typical cytofluorograms of monocyte subsets from a healthy subject (A) and an atherosclerotic patient (B); (C) Cumulative data on the percentage ratio of monocyte subsets in 15 healthy subjects (green bars) and 25 atherosclerotic patients (red bars). Values are presented as M ± SD. *,#P < 0.05