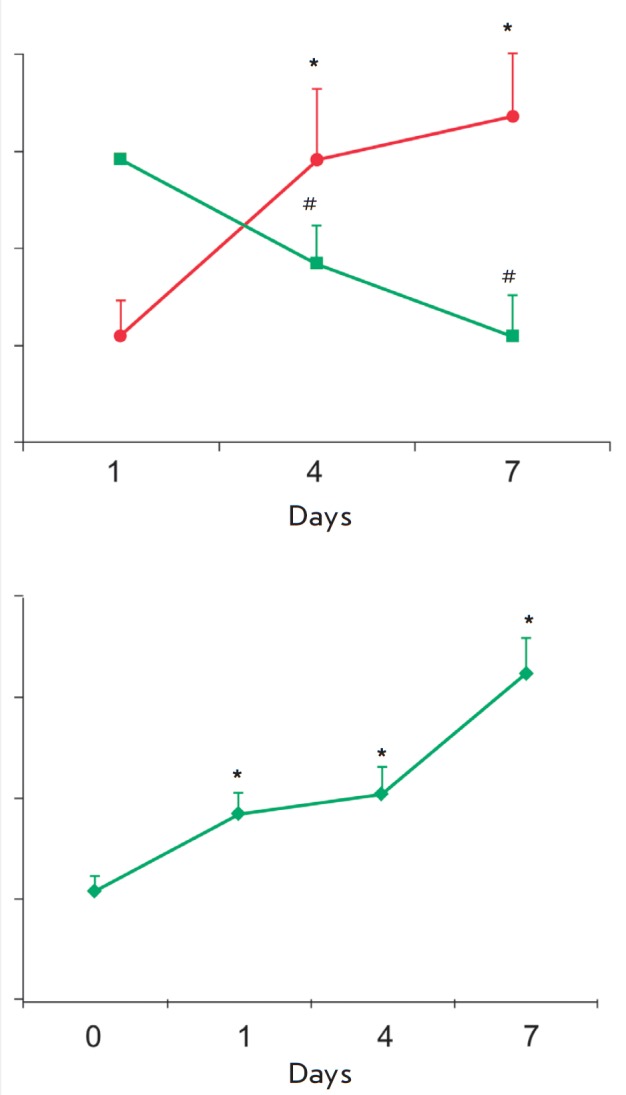
Fig. 6.

Cytofluorometric analysis of the in vitro differentiation of cultured monocytes from healthy subjects. (A) Change in the proportion of CD14+/CD16+ (sqare) and CD14+/CD206+ cells (circle) during the differentiation (n=3). *,#The differences are statistically significant between the 1st and the 4th day and the 1st and 7th day; (B) Change in the raft marker expression on CD14+/CD206+ cells during the differentiation (n=3). *The difference is significant between the reference point and 1st day, and the 1st and 7th day. Values are presented as M ± SD. *,#P < 0.05
