
Figure 3.
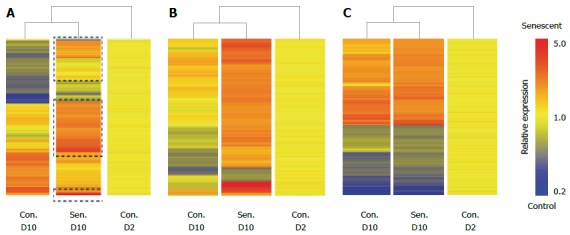
Senescent hepatocyte gene expression signature. Senescent hepatocytes (Sen.) were compared to untreated hepatocytes (Con.) at D (Day) 2 and D10 of the experimental protocol by illumina microarray. A: Hierarchical clustering of probes that were differentially expressed between control and senescent hepatocytes at D10; B: Hierarchical clustering of probes that were uniquely regulated in senescent hepatocytes; C: Hierarchical clustering of probes that were commonly regulated in senescent hepatocytes and untreated hepatocytes between D2 and D10. Probes are clustered by distance correlation with average linkage.